PROTECTED SOURCE SCRIPT
已更新 Volume Pivot Zone
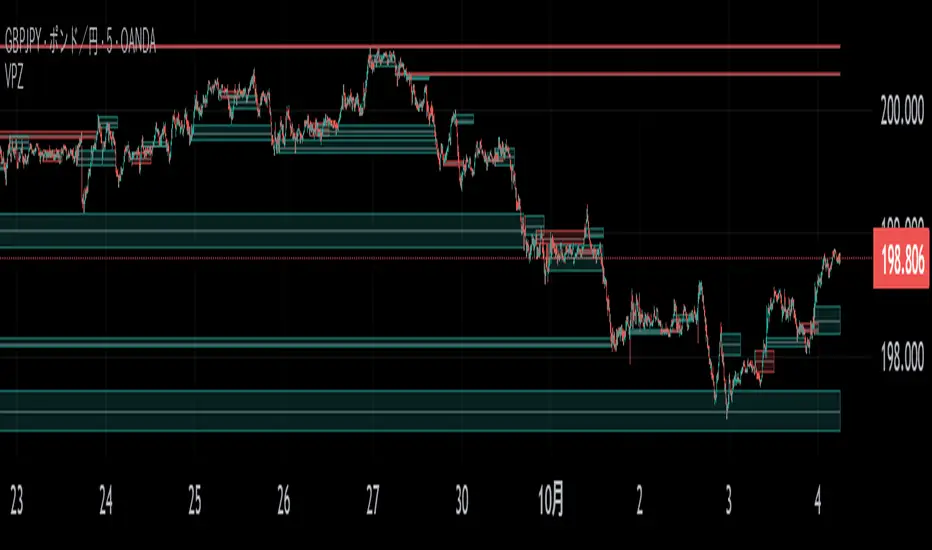
Overview
This indicator automatically draws boxes on your chart to show important price levels based on high trading volume.
What It Does:
Settings:
This indicator automatically draws boxes on your chart to show important price levels based on high trading volume.
What It Does:
- Finds High Volume Spots: It detects bars where the trading volume hits a peak (a "pivot").
- Draws Zones: It draws a box around the high and low of that high-volume bar and extends it to the right.
- Shows Different Timeframes: You can see zones from your current chart's timeframe (CTF) and a higher timeframe (HTF) at the same time. HTF zones are usually more significant.
- Manages Old Zones: Once the price touches or breaks through a zone, the indicator can automatically hide or remove it, keeping your chart clean.
Settings:
- Higher Timeframe Section
- CTF Show / HTF Show: Turn the zones for the current (CTF) or higher (HTF) timeframe on or off.
- 1Min:, 5Min:, etc.: Set which higher timeframe to use for your current chart. For example, you can tell it to show 1-hour zones on your 5-minute chart. - Volume Pivot Zone Section
- Show High: Draws zones based on volume peaks. (Most common)
- Show Low: Draws zones based on volume valleys.
- Lookback Length: How many bars to the left and right to check for a volume peak. A higher number finds only the most significant peaks.
- Invalidation Condition: When to consider a zone "used up." For example, Touch means the zone is invalidated as soon as the price touches it.
- Action: What to do with an invalidated zone. Remove deletes it, while Hide just makes it disappear.
- Color Settings: Customize the colors of the zones to your liking.
版本注释
update screenshot版本注释
fix bug受保护脚本
此脚本以闭源形式发布。 但是,您可以自由使用,没有任何限制 — 了解更多信息这里。
免责声明
这些信息和出版物并非旨在提供,也不构成TradingView提供或认可的任何形式的财务、投资、交易或其他类型的建议或推荐。请阅读使用条款了解更多信息。
免责声明
这些信息和出版物并非旨在提供,也不构成TradingView提供或认可的任何形式的财务、投资、交易或其他类型的建议或推荐。请阅读使用条款了解更多信息。