OPEN-SOURCE SCRIPT
已更新 EMA Slope
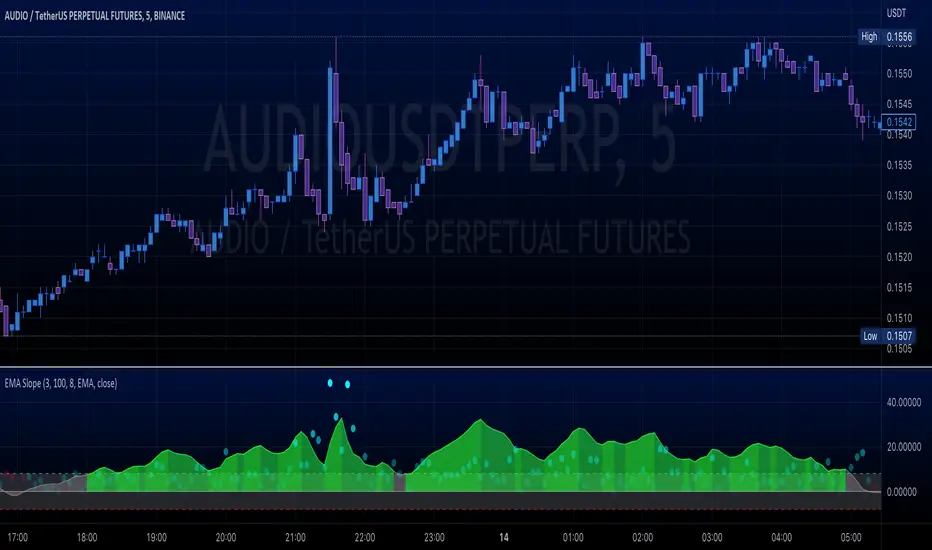
Just an easy way to monitor trends and avoid fake signals.
// Consolidation periods based on moving average slope.
// Sideways markets are the ultimate challenge to most strategies.
// No trading zones will dismiss some fake signals.
版本注释
In this version just minor adjustments版本注释
New version with minor adjustments.
Moving averages Slope with no trade zones where slope is under Threshold.
版本注释
Added visual volatility circles based on time time frame previous bar slope. High local slope leads to possible greater changes in market.
版本注释
Updated with some popular moving averages and source inoputs as well.版本注释
- Added a better way to scale moving average to 100 scale. This way is better to fit with other indicators like RSI for example.- Changed MA Acceleration to line for reading purposes.
版本注释
Small changes to make it better normalizing MA acceleration plots to last 200 bars. This will better fit in high priced assets.Changed Acceleration to circles, adding more transparency to low values.
版本注释
Minor changes in NTZ fill color.版本注释
Just added five alerts as suggested.EMA Slope changed to Up or Down direction
EMA Slope enters or leaves the No Trade Zone Channel.
版本注释
Alerts will trigger only off NTZ版本注释
The EMA slope, or Exponential Moving Average slope, is an indicator commonly used in technical analysis to identify and assess market trends. It measures the rate of change or the slope of the Exponential Moving Average line.The Exponential Moving Average is a type of moving average that places more weight on recent data points, making it more responsive to recent price changes. The EMA slope is derived from the EMA line by calculating the difference between the current EMA value and the EMA value from a certain period ago.
By monitoring the EMA slope, traders and investors can gain insights into the strength and direction of a market trend. When the EMA slope is positive, it indicates an upward trend, suggesting that prices are generally rising. Conversely, a negative EMA slope suggests a downward trend, indicating that prices are generally falling.
One important characteristic of the EMA slope is its proximity to zero. As a trend begins to lose momentum and potentially reverse, the EMA slope starts to approach zero. This means that the rate of change in the EMA line is slowing down, indicating a possible consolidation phase or a period of market indecision. This "grey zone" serves as an important visual representation of consolidation times, where the market is neither strongly bullish nor bearish.
The improved version of the indicator you mentioned likely enhances the functionality and display of the EMA slope. The improved alarms likely provide more accurate and customizable notifications when specific conditions related to the EMA slope are met, allowing traders to stay informed about potential trend changes. Additionally, the better display for the moving average acceleration likely provides a clearer and more intuitive representation of the EMA slope's behavior, enabling traders to quickly identify and interpret market trends.
Overall, the EMA slope indicator, with its ability to identify trend reversals and consolidation periods, can be a valuable tool for traders and investors in their decision-making process, helping them to better understand market dynamics and make more informed trading decisions.
开源脚本
秉承TradingView的精神,该脚本的作者将其开源,以便交易者可以查看和验证其功能。向作者致敬!您可以免费使用该脚本,但请记住,重新发布代码须遵守我们的网站规则。
免责声明
这些信息和出版物并非旨在提供,也不构成TradingView提供或认可的任何形式的财务、投资、交易或其他类型的建议或推荐。请阅读使用条款了解更多信息。
免责声明
这些信息和出版物并非旨在提供,也不构成TradingView提供或认可的任何形式的财务、投资、交易或其他类型的建议或推荐。请阅读使用条款了解更多信息。