INVITE-ONLY SCRIPT
NIBIRU SUPPORT AND RESISTANCE
已更新
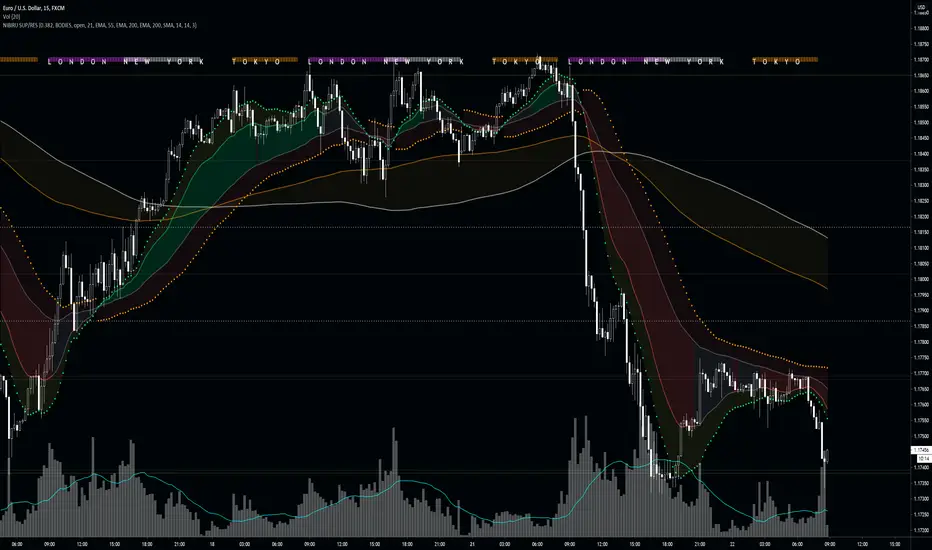
The Nibiru Support and Resistance Indicator is set of visual tools providing better trading experience. It is based on the classics of trading: horizontal trend lines and moving averages. It's main feature are automated support and resistance lines defining the main trading range and market structure, making it a superior tool to trade based on horizontal trend lines .
The set of moving averages along with entry and stop loss levels allows for easier risk management with trending strategies.
What does it plot?
Indicator components:

Horizontal trendlines
Moving Averages
Entry/Stop Loss hints
Pivot Points (beta) - Hints of potential short term trend reversals based on candle setups and patterns. Early beta, currently in testing–improvements and more patterns to be added.
Sessions - Indicating main trading sessions. This is a very important tool for trading traditional and OTC markets like forex. Knowing when money comes in and out of the market during the trading-day is crucial, because liquidity and volatility is the bread and butter for a consistently profitable trader. Due to limitations, this indicator is based on the exchange time zone. In the near future we will add a time offset option to fine tune to the time zone of the exchange you are trading on. Sessions are visible on all time frames below 4H.
The Nibiru Support and Resistance Indicator works on all assets that provide trading volume and all time frames.
Use the link below or PM me to gain access to the indicator.
The set of moving averages along with entry and stop loss levels allows for easier risk management with trending strategies.
What does it plot?
- Automatic horizontal support and resistance levels
- Main and local trading ranges
- Four moving averages with adjustable types and periods
- Entry and stop-loss level hints for trending strategy
- Pivot points based on candle patterns
- London, New York and Tokyo trading sessions indication based on exchange time
- Visual indication of current trend strength
Indicator components:
Horizontal trendlines
- Main trading range – dictating general price structure
- Local trading range – indicating current trading cluster
- Fibonacci trendlines – Fibonacci based trendlines dividing main trading range into tradeable support and resistance lines
- Fibonacci extensions of main trading range – for price trending out of main range it gives potential take profit levels by extending the range by selected Fibonacci ratio
Moving Averages
- MA 1 – fastest moving average for trending strategy entries. In addition this moving average provides color based information on current short term trend:
Green – uptrend
Red – downtrend
Gray - indecision - MA 2 – slower moving average for trending strategy risk management
- MA 3 and MA 4 – main trend change and support/resistance zone
Entry/Stop Loss hints
- Entry dots – early entry for moving average trending strategy
- Stop Loss (SL) dots – safe SL levels providing at least 1:2 RR setups at entry point
Pivot Points (beta) - Hints of potential short term trend reversals based on candle setups and patterns. Early beta, currently in testing–improvements and more patterns to be added.
Sessions - Indicating main trading sessions. This is a very important tool for trading traditional and OTC markets like forex. Knowing when money comes in and out of the market during the trading-day is crucial, because liquidity and volatility is the bread and butter for a consistently profitable trader. Due to limitations, this indicator is based on the exchange time zone. In the near future we will add a time offset option to fine tune to the time zone of the exchange you are trading on. Sessions are visible on all time frames below 4H.
The Nibiru Support and Resistance Indicator works on all assets that provide trading volume and all time frames.
Use the link below or PM me to gain access to the indicator.
版本注释
I have modified the algorithm and inputs used to generate this indicator.版本注释
I fixed obvious mistake in inputs where MA 2 and MA 3 were not named properly.版本注释
New features:- Source selector for Support/Resistance line generator
- Local range visibility checkbox
- Fibonacci levels visibility checkbox
- Fibonacci extension visibility checkbox
- Alert conditions for:
--- Support and resistance touch
--- Entry Dot touch
--- SL Dot touch
--- Pivot Point (Alert on open of next candle after Pivot forms)
Tweaks:
- Major Fibonacci lines (0.382 and 0.618) are plotted with thicker line
- Candles Formations changed name to Pivot Points
- Color of ‘no trade zone’ changed from orange to gray
Removed:
- Magic EMA
版本注释
Updated inputs to change the ADX settings and tuned the overall performance.版本注释
Technical update.仅限邀请脚本
仅限作者授权的用户访问此脚本,并且通常需要付费。您可以将其添加到收藏中,但是只有在向作者请求并获得许可之后,才能使用它。 请联系CJackiedaBear了解更多信息,或按照以下作者的说明操作。
TradingView不建议付费使用脚本,除非您100%信任作者并了解脚本的工作原理。在许多情况下,您可以在我们的社区脚本免费找到不错的开源替代方案。
作者的说明
″
想在图表上使用此脚本?
警告:请在申请访问权限之前阅读。
免责声明
这些信息和出版物并不意味着也不构成TradingView提供或认可的金融、投资、交易或其它类型的建议或背书。请在使用条款阅读更多信息。