OPEN-SOURCE SCRIPT
已更新 Foxy's Acceleration Bands
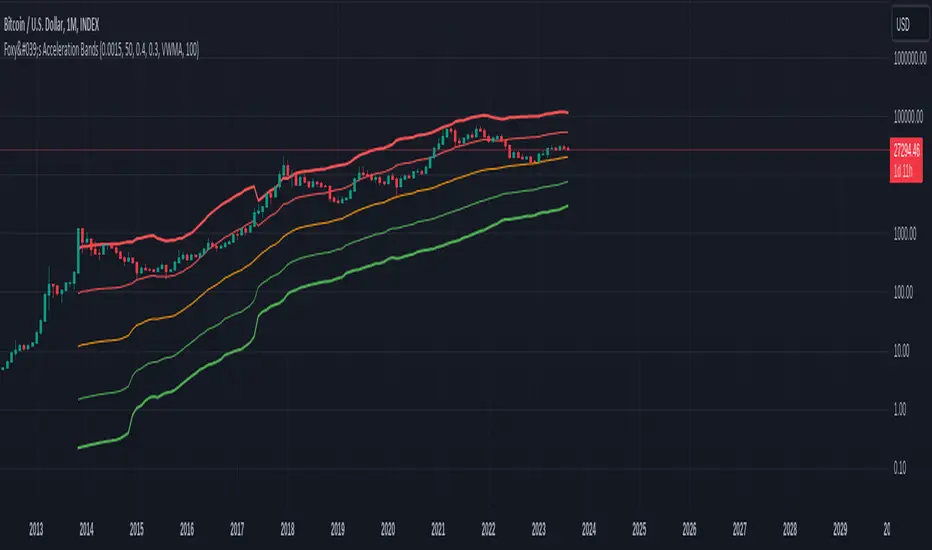
Foxy's Acceleration Bands is a dynamic technical indicator designed to help traders identify potential support and resistance levels using logarithmic regression and adaptable moving averages. By plotting bands around price movements, this indicator offers insights into potential zones where price acceleration, resistance, and support might occur.
How to Use:
Apply the "Foxy's Acceleration Bands" indicator to your TradingView chart.
Customize the indicator parameters as per your requirements:
factor: Adjust the sensitivity of the bands.
length: Set the length for moving averages and regression calculations.
mult: Modify the multiplier for upper bands.
Show Middle Bands: Toggle the display of middle bands.
Show Upper Bands: Toggle the display of upper bands.
Band MA Type: Choose the moving average type for the bands.
Middle MA Type: Select the moving average type for the central band.
Draw Prediction: Enable prediction lines for potential future price trends.
Prediction Slope Type: Choose between a fixed or dynamic slope length for prediction lines.
Fixed Slope Length: Set the slope length for prediction lines (if enabled).
Interpretation:
Upper Bands: The red upper bands indicate potential resistance zones where price acceleration might occur.
Middle Bands: The orange central band provides insights into the prevailing price trend.
Lower Bands: The green lower bands suggest potential support zones where price deceleration might happen.
Prediction Lines: If enabled, dotted lines visualize potential future price trends based on historical data.
Important Note: Foxy's Acceleration Bands is designed to assist traders in identifying potential support and resistance zones. Always complement its insights with other analysis techniques and prudent risk management strategies.
版本注释
Update Default MA and Some Parameters版本注释
Add Volume Average For Smoothing版本注释
Add Volume Paramter and Tweak Default Parameters版本注释
Clean-up & Refactor & Better Functionality版本注释
Add Volume Smoothing版本注释
Update Default Parameter版本注释
Add Adaptive MA版本注释
Fix Bug版本注释
Fix Major bug版本注释
Revert Last Fix (Doesn't Work Properly)版本注释
Add Super Fast Band版本注释
Fix Default Parameter版本注释
Add Auto-Length版本注释
Fix Length Selector版本注释
Fix Adaptive MA版本注释
Fix Default Timeframes Length版本注释
Fix Auto Timeframes版本注释
Fix Length Selector Value版本注释
Fix Log Issue版本注释
Fix typo版本注释
Fix Log Issue #2版本注释
Comment the un-needed function开源脚本
秉承TradingView的精神,该脚本的作者将其开源,以便交易者可以查看和验证其功能。向作者致敬!您可以免费使用该脚本,但请记住,重新发布代码须遵守我们的网站规则。
免责声明
这些信息和出版物并非旨在提供,也不构成TradingView提供或认可的任何形式的财务、投资、交易或其他类型的建议或推荐。请阅读使用条款了解更多信息。
开源脚本
秉承TradingView的精神,该脚本的作者将其开源,以便交易者可以查看和验证其功能。向作者致敬!您可以免费使用该脚本,但请记住,重新发布代码须遵守我们的网站规则。
免责声明
这些信息和出版物并非旨在提供,也不构成TradingView提供或认可的任何形式的财务、投资、交易或其他类型的建议或推荐。请阅读使用条款了解更多信息。