OPEN-SOURCE SCRIPT
Modified On Balance Volume
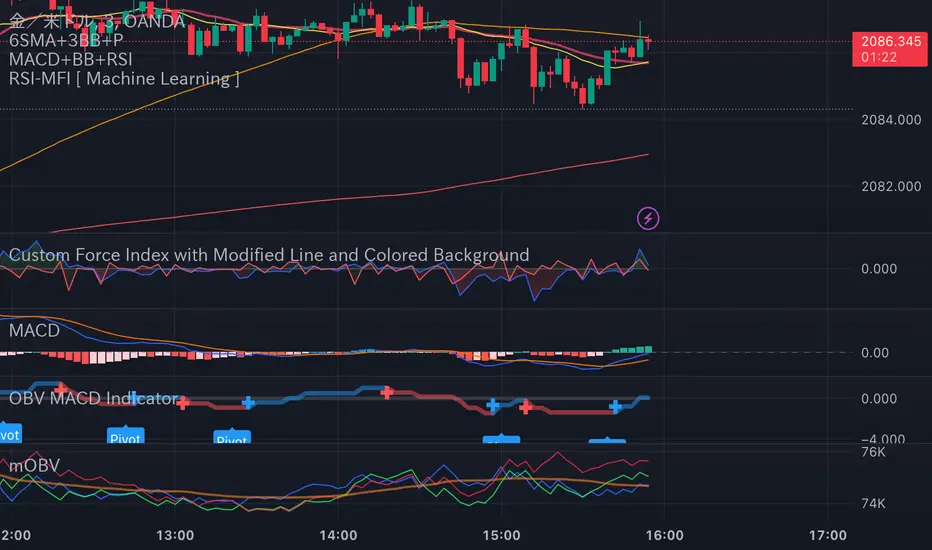
Modified On Balance Volume (mOBV) Indicator
The "Modified On Balance Volume" (mOBV) indicator is designed to provide insights into the cumulative buying and selling pressure in the market, with modifications for close, high, and low prices. It incorporates On Balance Volume (OBV) calculations for each of these price types and further refines the analysis by applying Simple Moving Averages (SMA).
Key Features:
Calculation of OBV for Close, High, and Low Prices:
Traditional OBV values are computed for close, high, and low prices, reflecting the cumulative volume based on the sign of price changes.
SMA Smoothing:
Simple Moving Averages (SMA) are applied to the calculated OBV values, introducing a smoothing effect to highlight trends in the buying and selling pressure.
Relative Values for High and Low OBV:
The script transforms the OBV values for high and low prices into relative values compared to the SMA of the OBV for close prices.
User-Defined SMA Length:
Users can customize the length of the SMA through a parameter, allowing flexibility in adapting the indicator to different market conditions.
Error Handling:
The script includes a mechanism to detect if no volume data is provided by the data vendor, alerting users to potential issues with the dataset.
Visual Representation:
The calculated OBV values for close, high, and low prices, as well as the SMA of the OBV for close prices, are visually represented on the chart with customizable colors and transparency settings.
Usage Tips:
Rising values indicate increasing buying pressure, while falling values suggest increasing selling pressure.
Crosses between the OBV lines and the SMA line may be used to identify potential trend changes.
Note:
This script is intended for informational purposes and should be used in conjunction with other technical analysis tools for comprehensive market analysis.
开源脚本
秉承TradingView的精神,该脚本的作者将其开源,以便交易者可以查看和验证其功能。向作者致敬!您可以免费使用该脚本,但请记住,重新发布代码须遵守我们的网站规则。
免责声明
这些信息和出版物并非旨在提供,也不构成TradingView提供或认可的任何形式的财务、投资、交易或其他类型的建议或推荐。请阅读使用条款了解更多信息。
免责声明
这些信息和出版物并非旨在提供,也不构成TradingView提供或认可的任何形式的财务、投资、交易或其他类型的建议或推荐。请阅读使用条款了解更多信息。