OPEN-SOURCE SCRIPT
correlation
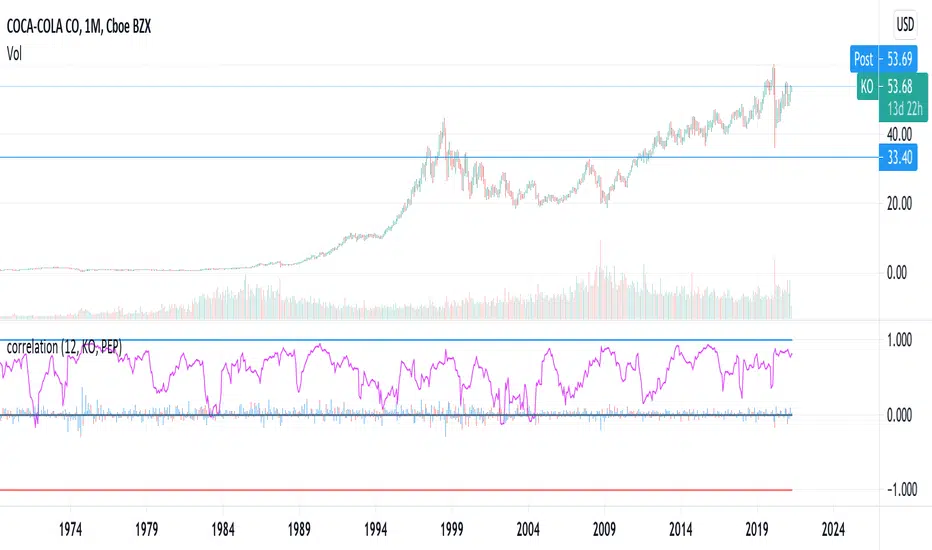
Choose two assets using the inputs, and plot their correlation. The correlation between their percentage returns is shown in purple, and the returns themselves are shown as small histograms.
By default, the correlation is computed over 12 periods, but you can adjust this as well using the inputs.
By default, the correlation is computed over 12 periods, but you can adjust this as well using the inputs.
开源脚本
秉承TradingView的精神,该脚本的作者将其开源,以便交易者可以查看和验证其功能。向作者致敬!您可以免费使用该脚本,但请记住,重新发布代码须遵守我们的网站规则。
免责声明
这些信息和出版物并非旨在提供,也不构成TradingView提供或认可的任何形式的财务、投资、交易或其他类型的建议或推荐。请阅读使用条款了解更多信息。
免责声明
这些信息和出版物并非旨在提供,也不构成TradingView提供或认可的任何形式的财务、投资、交易或其他类型的建议或推荐。请阅读使用条款了解更多信息。