OPEN-SOURCE SCRIPT
Linear Regression with StdDev Bands
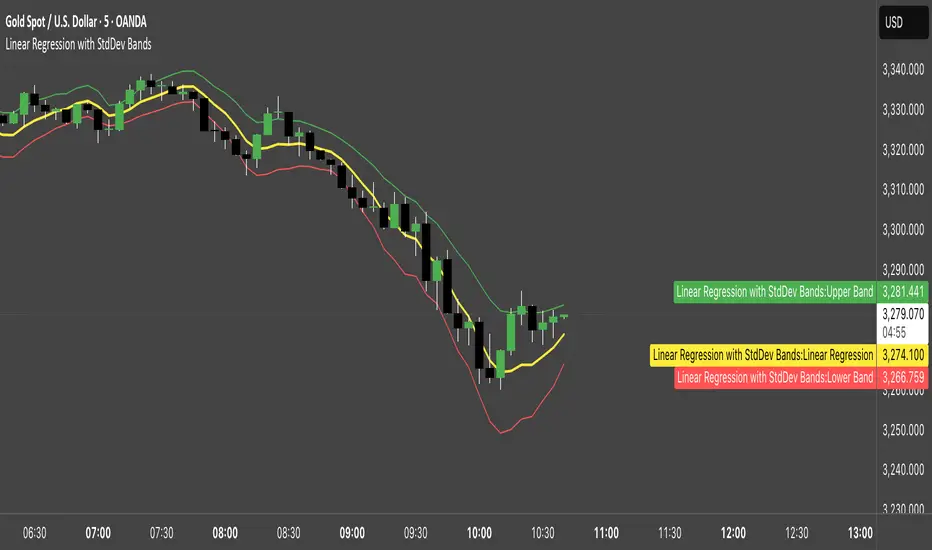
Linear Regression with Standard Deviation Bands Indicator
This indicator plots a linear regression line along with upper and lower bands based on standard deviation. It helps identify potential overbought and oversold conditions, as well as trend direction and strength.
Key Components:
Linear Regression Line: Represents the average price over a specified period.
Upper and Lower Bands: Calculated by adding and subtracting the standard deviation (multiplied by a user-defined factor) from the linear regression line. These bands act as dynamic support and resistance levels.
How to Use:
Trend Identification: The direction of the linear regression line indicates the prevailing trend.
Overbought/Oversold Signals: Prices approaching or crossing the upper band may suggest overbought conditions, while prices near the lower band may indicate oversold conditions.
Dynamic Support/Resistance: The bands can act as potential support and resistance levels.
Alerts: Option to enable alerts when the price crosses above the upper band or below the lower band.
Customization:
Regression Length: Adjust the period over which the linear regression is calculated.
StdDev Multiplier: Modify the width of the bands by changing the standard deviation multiplier.
Price Source: Choose which price data to use for calculations (e.g., close, open, high, low).
Alerts: Enable or disable alerts for band crossings.
This indicator is a versatile tool for understanding price trends and potential reversal points.
开源脚本
秉承TradingView的精神,该脚本的作者将其开源,以便交易者可以查看和验证其功能。向作者致敬!您可以免费使用该脚本,但请记住,重新发布代码须遵守我们的网站规则。
免责声明
这些信息和出版物并非旨在提供,也不构成TradingView提供或认可的任何形式的财务、投资、交易或其他类型的建议或推荐。请阅读使用条款了解更多信息。
开源脚本
秉承TradingView的精神,该脚本的作者将其开源,以便交易者可以查看和验证其功能。向作者致敬!您可以免费使用该脚本,但请记住,重新发布代码须遵守我们的网站规则。
免责声明
这些信息和出版物并非旨在提供,也不构成TradingView提供或认可的任何形式的财务、投资、交易或其他类型的建议或推荐。请阅读使用条款了解更多信息。