OPEN-SOURCE SCRIPT
已更新 Multi-timeframe Trend & Momentum Dashboard
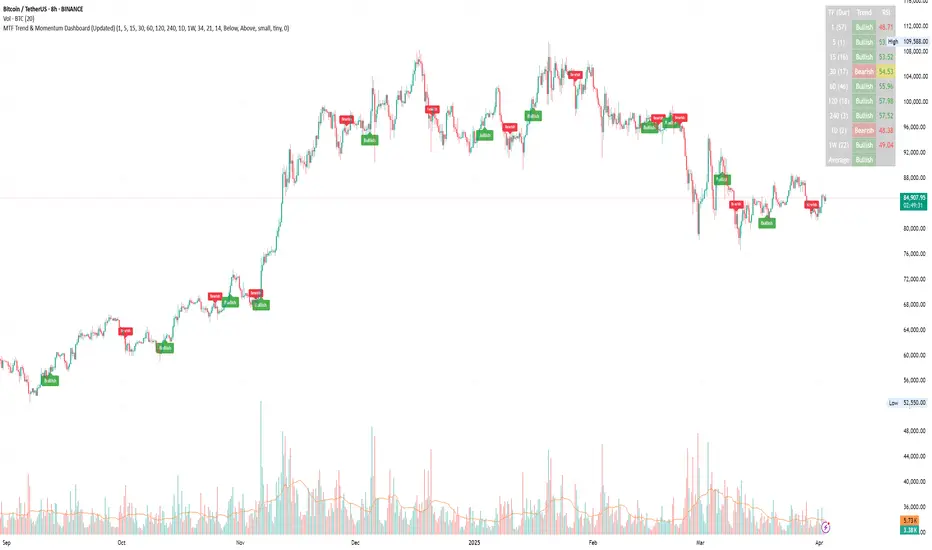
Multi-Timeframe Trend & Momentum Dashboard
This indicator is a comprehensive multi-timeframe analysis tool designed for traders who want to quickly assess market trends and momentum across several timeframes. It combines trend detection with duration tracking and displays key information in an easy-to-read on-chart table. Key features include:
Multi-Timeframe Analysis:
Analyzes nine different timeframes (from 1-minute up to 1-week) simultaneously, helping you gauge the overall market trend at a glance.
Trend Detection & Duration:
Uses a combination of a short-term EMA and a long-term SMA to determine whether the market is bullish, bearish, or neutral. It also tracks how long the current trend has persisted in terms of consecutive bars and displays this duration next to each timeframe.
RSI Display & Visual Alerts:
Calculates the RSI for each timeframe. RSI values are color-coded—green when above 50 (indicating bullish momentum) and red when below 50 (indicating bearish conditions). Additionally, if the market is bearish on a particular timeframe while the RSI is above 50, the RSI cell flashes yellow to alert you of a potential trend reversal or divergence.
On-Chart Trend Start Markers:
When a new trend is detected on your current chart’s timeframe, the indicator automatically marks the bar with a label showing the new trend direction, providing a clear visual cue for trend changes.
This powerful tool is perfect for traders looking to combine multi-timeframe trend analysis with momentum indicators, enabling a more informed and dynamic trading strategy. Whether you’re a day trader or swing trader, the Multi-Timeframe Trend & Momentum Dashboard brings clarity to market conditions across multiple time horizons.
版本注释
Update DescriptionLabel Placement Options:
Added new inputs allowing the user to choose whether bullish labels appear above or below the bar (default set to “Above”) and bearish labels below or above the bar (default set to “Below”). This gives you control over where the trend start labels are placed on the chart.
Label Customization:
New inputs have been introduced for label customization. You can now select:
The background color for bullish and bearish labels.
The text color for each label.
The label size, with options such as “tiny,” “small,” “normal,” and “large.”
版本注释
Short Update DescriptionNew Table Options: Added an option to show or hide the trend/RSI table.
MA Diff Column: Included a new table column displaying the difference between the EMA and SMA.
Label Transparency: Introduced an input to adjust label transparency.
版本注释
.开源脚本
秉承TradingView的精神,该脚本的作者将其开源,以便交易者可以查看和验证其功能。向作者致敬!您可以免费使用该脚本,但请记住,重新发布代码须遵守我们的网站规则。
免责声明
这些信息和出版物并非旨在提供,也不构成TradingView提供或认可的任何形式的财务、投资、交易或其他类型的建议或推荐。请阅读使用条款了解更多信息。
免责声明
这些信息和出版物并非旨在提供,也不构成TradingView提供或认可的任何形式的财务、投资、交易或其他类型的建议或推荐。请阅读使用条款了解更多信息。