INVITE-ONLY SCRIPT
Price Volatility Index[Version No.1]
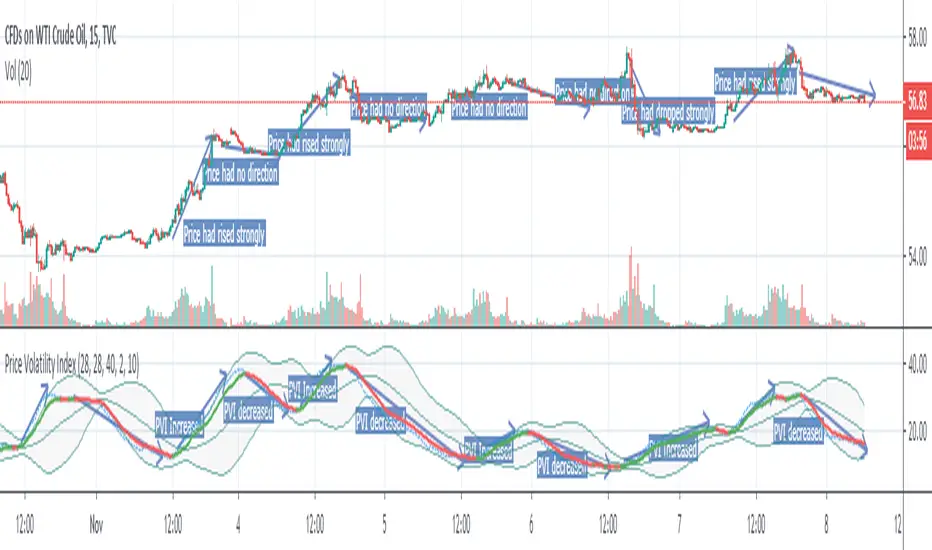
The 'Price Volatility index' indicator shows the amplitude of the price. It's called PVI.
If the PVI index rises, it means that the inertia of the price is sufficiently supplied.
The key point here is that the rise in the PVI index doesn't mean the price is going up, and the decline in the PVI index is not going to go down.
Shows the strength of the amplitude of the price regardless of directionality.
If the PVI indicator rises, it means that the amplitude of the price is strong, and if the PVI indicator decreases, the amplitude of the price will be weakened, indicating a directionless market.
"This indicator had reused indicator which name is 'CEMA'.
Reused indicator URL:[url= tradingview.com/u/mvtradeide...] tradingview.com/u/mvtradeide...
reused indicator 'CEMA' CODE
study(title="Color EMA", shorttitle="CEMA", overlay=true)
en = input (10, minval=1, Title="Length")
src = input(close, Title="Source")
out = ema ( src , le)
(out, color=out>out?green:out[out?red:blue, linewidth=2, transsp=0, Title="CEMA")
仅限邀请脚本
仅限作者授权的用户访问此脚本,并且通常需要付费。您可以将其添加到收藏中,但是只有在向作者请求并获得许可之后,才能使用它。 请联系HAMTOOSA_ACADEMY了解更多信息,或按照以下作者的说明操作。
TradingView does not suggest paying for a script and using it unless you 100% trust its author and understand how the script works. In many cases, you can find a good open-source alternative for free in our Community Scripts.
想在图表上使用此脚本?
警告:请在申请访问权限之前阅读。
免责声明
这些信息和出版物并不意味着也不构成TradingView提供或认可的金融、投资、交易或其它类型的建议或背书。请在使用条款阅读更多信息。