OPEN-SOURCE SCRIPT
Zero-Lag MA Trend Levels [ChartPrime]
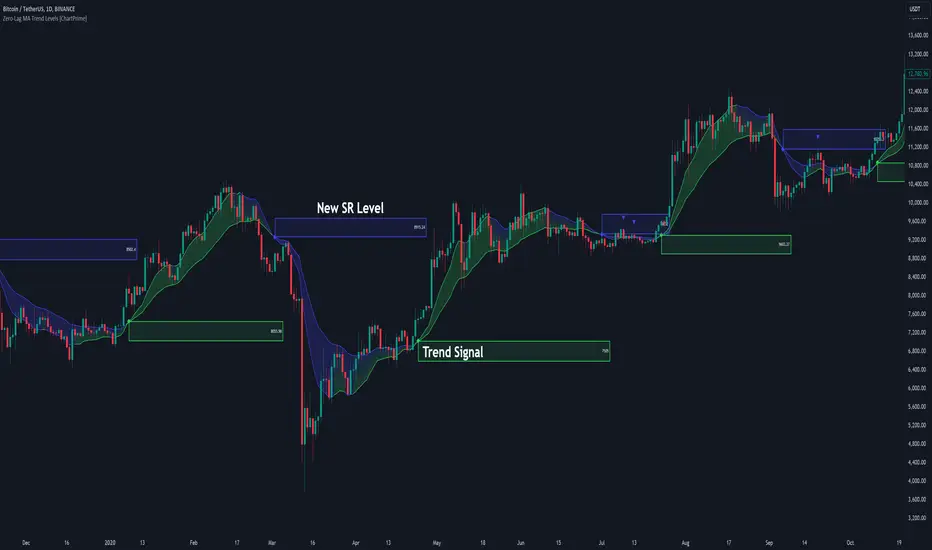
The Zero-Lag MA Trend Levels [ChartPrime] indicator combines a Zero-Lag Moving Average (ZLMA) with a standard Exponential Moving Average (EMA) to provide a dynamic view of the market trend. This indicator uses a color-changing cloud to represent shifts in trend momentum and plots key levels when trend reversals are detected. The addition of trend level boxes helps identify significant price zones where market shifts occur, with retest signals aiding in spotting potential continuation or reversal points.
⯁ KEY FEATURES & HOW TO USE
⯌ Zero-Lag Moving Average (ZLMA) with EMA Cloud:
The indicator employs a Zero-Lag Moving Average (ZLMA) alongside a standard EMA.
Pine Script®
The cloud between these averages changes color depending on the trend direction. During a downtrend, if the ZLMA begins to increase, the cloud partially turns green, signaling potential strength. Conversely, during an uptrend, if the ZLMA decreases, the cloud partially turns to the downtrend color (blue by default), indicating potential weakness.
Use: Traders can monitor the cloud's color shifts for early signs of changing momentum. A fully colored cloud aligning with the current trend indicates a strong directional move, while mixed colors suggest a potential trend change.


⯌ Trend Shift and Level Boxes:
Each time a crossover between the EMA and the ZLMA occurs, indicating a trend shift, the indicator plots a box around the price level where the shift occurred. This box remains on the chart to mark the price zone of the trend change.
Use: The boxes provide clear visual markers of where market sentiment shifted. These levels can act as support and resistance zones. Traders can use these boxes to identify potential entry or exit points when the market retests these key levels.

⯌ Retest Detection with Labels:
If the price action crosses a previously plotted trend level box, the indicator marks this event with triangle labels. An upward triangle (▲) appears when the price retests the top of a box during a bullish crossover, and a downward triangle (▼) appears when the price retests the bottom of a box during a bearish crossunder.
Use: These labels help traders identify potential continuation or reversal points at critical price levels, offering additional confirmation for trading decisions.

⯌ Dynamic Color-Coding:
The color of the ZLMA and the EMA is adjusted according to their current trend direction, with the ZLMA adopting green for upward trends and blue for downward trends. This visual representation makes it easier to quickly gauge the market's momentum at a glance.
Use: Traders can use the color-coding to quickly assess the strength and direction of the current trend, allowing for more informed decision-making.

⯁ USER INPUTS

⯁ CONCLUSION
The Zero-Lag MA Trend Levels - ChartPrime indicator offers a nuanced approach to trend detection by combining the ZLMA with a traditional EMA. Its dynamic cloud color changes, trend level boxes, and retest labels make it a versatile tool for traders seeking to identify trend shifts and key price zones effectively. By incorporating elements of support and resistance along with trend momentum, this indicator provides a comprehensive view of market dynamics for both trend-following and counter-trend trading strategies.
⯁ KEY FEATURES & HOW TO USE
⯌ Zero-Lag Moving Average (ZLMA) with EMA Cloud:
The indicator employs a Zero-Lag Moving Average (ZLMA) alongside a standard EMA.
series float emaValue = ta.ema(close, length) // EMA of the closing price
series float correction = close + (close - emaValue) // Correction factor for zero-lag calculation
series float zlma = ta.ema(correction, length) // Zero-Lag Moving Average (ZLMA)
The cloud between these averages changes color depending on the trend direction. During a downtrend, if the ZLMA begins to increase, the cloud partially turns green, signaling potential strength. Conversely, during an uptrend, if the ZLMA decreases, the cloud partially turns to the downtrend color (blue by default), indicating potential weakness.
Use: Traders can monitor the cloud's color shifts for early signs of changing momentum. A fully colored cloud aligning with the current trend indicates a strong directional move, while mixed colors suggest a potential trend change.
⯌ Trend Shift and Level Boxes:
Each time a crossover between the EMA and the ZLMA occurs, indicating a trend shift, the indicator plots a box around the price level where the shift occurred. This box remains on the chart to mark the price zone of the trend change.
Use: The boxes provide clear visual markers of where market sentiment shifted. These levels can act as support and resistance zones. Traders can use these boxes to identify potential entry or exit points when the market retests these key levels.
⯌ Retest Detection with Labels:
If the price action crosses a previously plotted trend level box, the indicator marks this event with triangle labels. An upward triangle (▲) appears when the price retests the top of a box during a bullish crossover, and a downward triangle (▼) appears when the price retests the bottom of a box during a bearish crossunder.
Use: These labels help traders identify potential continuation or reversal points at critical price levels, offering additional confirmation for trading decisions.
⯌ Dynamic Color-Coding:
The color of the ZLMA and the EMA is adjusted according to their current trend direction, with the ZLMA adopting green for upward trends and blue for downward trends. This visual representation makes it easier to quickly gauge the market's momentum at a glance.
Use: Traders can use the color-coding to quickly assess the strength and direction of the current trend, allowing for more informed decision-making.
⯁ USER INPUTS
- Length: Sets the period for both the ZLMA and EMA calculations.
- Trend Levels: Toggle to display the trend level boxes on the chart.
- Colors (+ / -): Define the colors for bullish and bearish trends.
⯁ CONCLUSION
The Zero-Lag MA Trend Levels - ChartPrime indicator offers a nuanced approach to trend detection by combining the ZLMA with a traditional EMA. Its dynamic cloud color changes, trend level boxes, and retest labels make it a versatile tool for traders seeking to identify trend shifts and key price zones effectively. By incorporating elements of support and resistance along with trend momentum, this indicator provides a comprehensive view of market dynamics for both trend-following and counter-trend trading strategies.
开源脚本
秉承TradingView的精神,该脚本的作者将其开源,以便交易者可以查看和验证其功能。向作者致敬!您可以免费使用该脚本,但请记住,重新发布代码须遵守我们的网站规则。
免责声明
这些信息和出版物并非旨在提供,也不构成TradingView提供或认可的任何形式的财务、投资、交易或其他类型的建议或推荐。请阅读使用条款了解更多信息。
开源脚本
秉承TradingView的精神,该脚本的作者将其开源,以便交易者可以查看和验证其功能。向作者致敬!您可以免费使用该脚本,但请记住,重新发布代码须遵守我们的网站规则。
免责声明
这些信息和出版物并非旨在提供,也不构成TradingView提供或认可的任何形式的财务、投资、交易或其他类型的建议或推荐。请阅读使用条款了解更多信息。