OPEN-SOURCE SCRIPT
Vulkan Profit
Overview
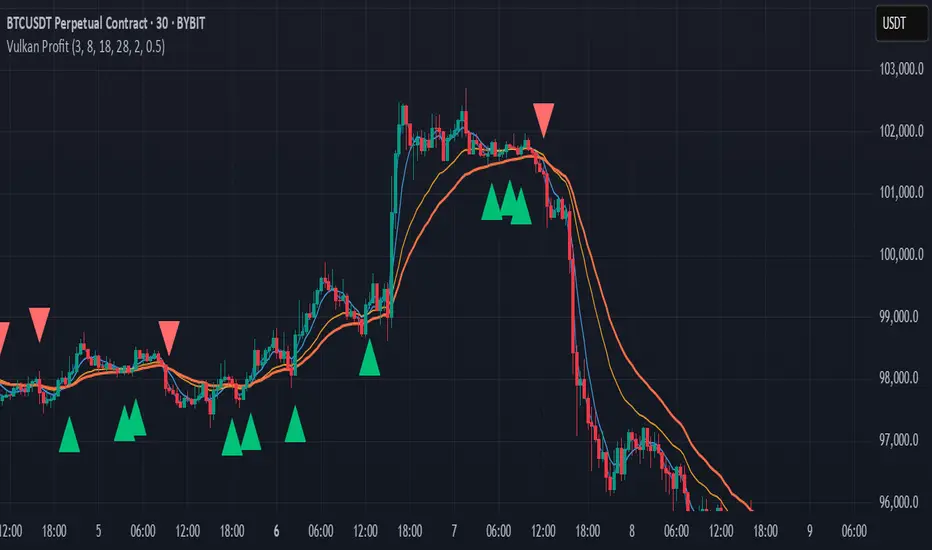
The Vulkan Profit indicator is a trend-following tool that identifies potential entry and exit points by monitoring the relationship between short-term and long-term moving averages. It generates clear buy and sell signals when specific moving average conditions align, making it useful for traders looking to confirm trend changes across multiple timeframes.
How It Works
The indicator utilizes four different moving averages:
Fast WMA (period 3) - A highly responsive weighted moving average
Medium WMA (period 8) - A less sensitive weighted moving average
Fast EMA (period 18) - A responsive exponential moving average
Slow EMA (period 28) - A slower exponential moving average
These moving averages are grouped into two categories:
Short-term MAs: Fast WMA and Medium WMA
Long-term MAs: Fast EMA and Slow EMA
Signal Generation Logic
The Vulkan Profit indicator generates signals based on the relative positions of these moving averages:
Buy Signal (Green Triangle)
A buy signal appears when the minimum value of the short-term MAs becomes greater than the maximum value of the long-term MAs. In other words, when both short-term MAs cross above both long-term MAs.
Sell Signal (Red Triangle)
A sell signal appears when the maximum value of the short-term MAs becomes less than the minimum value of the long-term MAs. In other words, when both short-term MAs cross below both long-term MAs.
Visual Components
Moving Averages - All four moving averages can be displayed or hidden
Signal Arrows - Green triangles for buy signals, red triangles for sell signals
Colored Line - A line that changes color based on the current market stance (green for bullish, red for bearish)
Customization Options
The indicator offers several customization settings:
Toggle the visibility of moving averages
Toggle the visibility of buy/sell signals
Adjust the color, width, and position of the signal line
Choose between different line styles (Line, Stepline, Histogram)
Practical Trading Applications
Trend Identification: The relative positioning of all moving averages helps identify the current market trend
Entry/Exit Points: The buy and sell signals can be used as potential entry and exit points
Trend Confirmation: The colored line provides ongoing confirmation of the trend direction
Filter: Can be used in conjunction with other indicators as a trend filter
Trading Strategy Suggestions
Trend Following: Enter long positions on buy signals and exit on sell signals during trending markets
Confirmation Tool: Use the signals to confirm trades identified by other indicators
Timeframe Analysis: Apply the indicator across multiple timeframes for stronger confirmation
Risk Management: Place stop-loss orders below recent swing lows for long positions and above recent swing highs for short positions
Tips for Best Results
The indicator performs best in trending markets and may generate false signals in ranging or highly volatile markets
Consider the broader market context before taking trades based solely on these signals
Use appropriate position sizing and risk management regardless of the indicator's signals
The longer timeframes generally produce more reliable signals with fewer false positives
The Vulkan Profit indicator combines the responsiveness of short-term averages with the stability of long-term averages to capture significant trend changes while filtering out minor price fluctuations.
开源脚本
秉承TradingView的精神,该脚本的作者将其开源,以便交易者可以查看和验证其功能。向作者致敬!您可以免费使用该脚本,但请记住,重新发布代码须遵守我们的网站规则。
Full time Retail Algo Trader. pine-strategies.com
免责声明
这些信息和出版物并非旨在提供,也不构成TradingView提供或认可的任何形式的财务、投资、交易或其他类型的建议或推荐。请阅读使用条款了解更多信息。
开源脚本
秉承TradingView的精神,该脚本的作者将其开源,以便交易者可以查看和验证其功能。向作者致敬!您可以免费使用该脚本,但请记住,重新发布代码须遵守我们的网站规则。
Full time Retail Algo Trader. pine-strategies.com
免责声明
这些信息和出版物并非旨在提供,也不构成TradingView提供或认可的任何形式的财务、投资、交易或其他类型的建议或推荐。请阅读使用条款了解更多信息。