OPEN-SOURCE SCRIPT
Luma Signals – Orderflow Imbalance
Luma Signals – Imbalance Detector
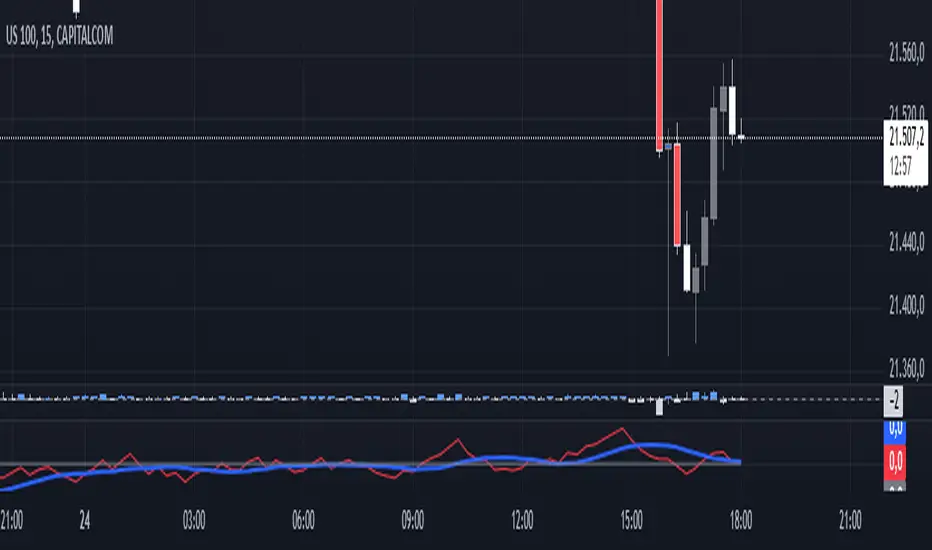
The Luma Signals – Imbalance Detector highlights price inefficiencies where buying or selling pressure dominates, causing rapid market movements. These imbalances can act as potential support and resistance zones or indicate areas where liquidity needs to be filled.
🔹 Key Features:
✔ Identifies Bullish & Bearish Imbalances – Blue candles indicate strong buying pressure, red candles indicate strong selling pressure.
✔ Clear Market Structure – Normal bullish candles appear in light gray, normal bearish candles in white.
✔ Dynamic Orderflow Analysis – Helps traders spot high-volatility price movements and potential reversals.
✔ No repainting & lightweight – The indicator works in real-time without altering past data.
📊 How to Use:
Trend Confirmation: If an imbalance aligns with a strong trend, it may indicate trend continuation.
Liquidity Gaps: Price often revisits imbalances before continuing its movement.
Scalping & Intraday Trading: Identify key reaction points for short-term trades.
开源脚本
秉承TradingView的精神,该脚本的作者将其开源,以便交易者可以查看和验证其功能。向作者致敬!您可以免费使用该脚本,但请记住,重新发布代码须遵守我们的网站规则。
免责声明
这些信息和出版物并非旨在提供,也不构成TradingView提供或认可的任何形式的财务、投资、交易或其他类型的建议或推荐。请阅读使用条款了解更多信息。
开源脚本
秉承TradingView的精神,该脚本的作者将其开源,以便交易者可以查看和验证其功能。向作者致敬!您可以免费使用该脚本,但请记住,重新发布代码须遵守我们的网站规则。
免责声明
这些信息和出版物并非旨在提供,也不构成TradingView提供或认可的任何形式的财务、投资、交易或其他类型的建议或推荐。请阅读使用条款了解更多信息。