OPEN-SOURCE SCRIPT
已更新 Price Iterations with Pips
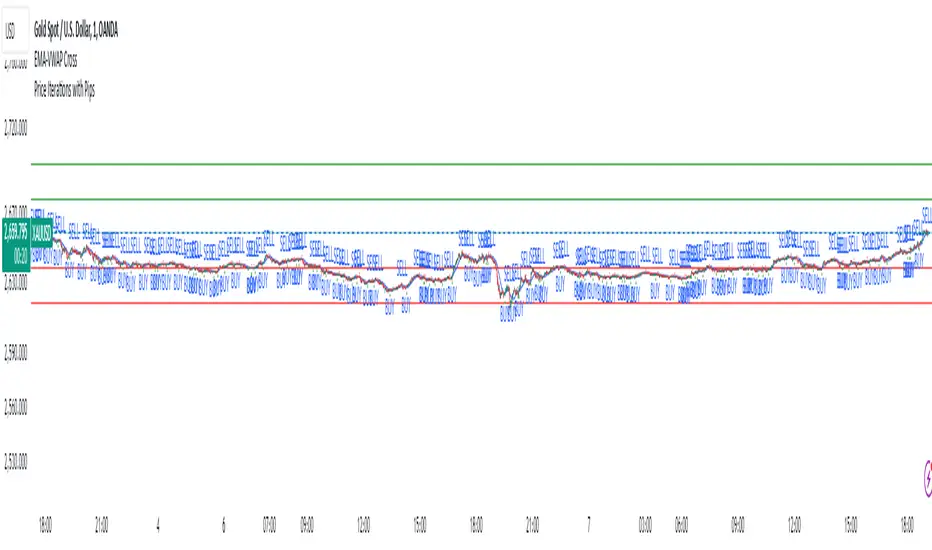
*Script Name:* Price Iterations with Pips
*Description:* This script plots horizontal lines above and below a user-defined initial price, representing price iterations based on a specified number of pips.
*Functionality:*
1. Asks for user input:
- Initial Price
- Pips per Iteration
- Number of Iterations
2. Calculates the price change per pip.
3. Plots horizontal lines:
- Above the initial price (green)
- Below the initial price (red)
4. Extends lines dynamically to both sides.
*Use Cases:*
1. *Support and Resistance Levels:* Use the script to visualize potential support and resistance levels based on price iterations.
2. *Price Targets:* Set the initial price as a target and use the iterations to estimate potential profit/loss levels.
3. *Risk Management:* Utilize the script to visualize risk levels based on pip iterations.
4. *Technical Analysis:* Combine the script with other technical indicators to identify potential trading opportunities.
*Trading Platforms:* This script is designed for TradingView.
*How to Use:*
1. Add the script to your TradingView chart.
2. Set the initial price, pips per iteration, and number of iterations.
3. Adjust the colors and line styles as needed.
4. Zoom in/out and pan to see the lines adjust.
*Benefits:*
1. Visualize price iterations and potential support/resistance levels.
2. Simplify risk management and price target estimation.
3. Enhance technical analysis with customizable price levels.
版本注释
I have updated the Multiplier value,Users have to Insert the current price of the Instrument and experiment with the Multiplier value and Pips per Iteration to mark the Equidistant levels from the given Initial value.
版本注释
Corrected the Mistakes in code开源脚本
秉承TradingView的精神,该脚本的作者将其开源,以便交易者可以查看和验证其功能。向作者致敬!您可以免费使用该脚本,但请记住,重新发布代码须遵守我们的网站规则。
免责声明
这些信息和出版物并非旨在提供,也不构成TradingView提供或认可的任何形式的财务、投资、交易或其他类型的建议或推荐。请阅读使用条款了解更多信息。
开源脚本
秉承TradingView的精神,该脚本的作者将其开源,以便交易者可以查看和验证其功能。向作者致敬!您可以免费使用该脚本,但请记住,重新发布代码须遵守我们的网站规则。
免责声明
这些信息和出版物并非旨在提供,也不构成TradingView提供或认可的任何形式的财务、投资、交易或其他类型的建议或推荐。请阅读使用条款了解更多信息。