INVITE-ONLY SCRIPT
PairTradingSignals
Pair Trading Signals (PTS)
This indicator implements a mean-reversion strategy for pairs trading, focusing on divergences between the chart's primary symbol (e.g., QQQ for tech exposure) and a user-specified inverse or correlated secondary symbol (default: SPY for broad market proxy). It generates long-only entry and exit signals on the primary asset based on statistical deviations in their relative pricing, without requiring short positions or direct trading of the secondary symbol.
Core Concepts
Pairs Mean Reversion: The strategy exploits temporary mispricings in cointegrated assets. When the primary asset becomes "cheap" relative to the secondary (oversold spread), it enters a long position expecting convergence. Exits occur when the spread reverts to neutral or overbought levels.
Spread & Z-Score: The raw spread is calculated as Primary Close - (Hedge Ratio × Secondary Close), with a fixed hedge ratio of 1.5 to approximate relative volatility (e.g., beta adjustment). This is normalized to a Z-score over a lookback period, measuring deviations in standard deviations from the historical mean. Bounds (default ±2.0) define oversold/overbought thresholds—common in statistical arbitrage for 95% confidence intervals assuming normality.
ATR-Based Risk Controls: Entry levels incorporate Average True Range (ATR, default 14-period RMA smoothing) to set dynamic take-profit (TP = Entry + Upper Bound × ATR) and stop-loss (SL = Entry - |Lower Bound| × ATR) levels, scaling to volatility.
Signal Logic
Buy (Long Entry): Triggers when the Z-score crosses above the lower bound (-2.0) after entering an oversold state (Z < lower bound). This signals undervaluation of the primary relative to the secondary.
Sell (Exit): Triggers when the Z-score crosses below the upper bound (2.0) after entering an overbought state (Z > upper bound). Optional strict TP/SL enforcement closes positions at predefined levels.
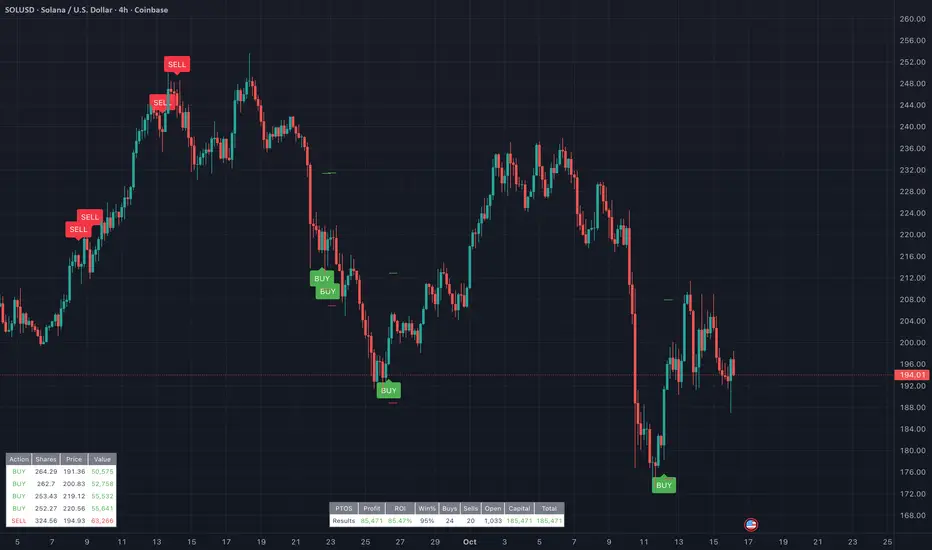
Signals appear as labeled shapes (green BUY below bar, red SELL above). Short horizontal boxes mark TP (green) and SL (red) for visual reference.
Backtesting & Performance Metrics
Simulation Period: Trades only within user-defined start/end dates (default: Jan 2020–Dec 2030).
Position Sizing: Fixed allocation based on initial capital × entry percentage (default 100%), capped by available equity to enforce risk limits. Supports full compounding if desired via code tweak.
Metrics Table: Displays net profit, ROI (including/excluding unrealized P&L), win rate, trade counts, closed capital, total equity, and open position details (shares or current value). Recent trades logged in a separate table.
Equity Floor: Prevents capital from going below zero, simulating real-world drawdown limits.
Usage Guidelines
Symbol Setup: Apply to the primary asset's chart (e.g., QQQ). Set "Inverse Ticker" to a negatively or positively correlated pair (e.g., SPY for market hedge).
Parameter Tuning: Increase lookback (20+) for smoother signals; widen bounds (±3.0) for fewer, higher-conviction trades. Lower entry % reduces risk.
Best Practices: Use on daily/4H timeframes for swing trades. Combine with overall market trend filters. Backtest across regimes (e.g., bull/bear) to validate.
Limitations: Assumes mean reversion holds; performs poorly in trending divergences. No commissions/slippage modeled—adjust initial capital accordingly.
This approach draws from classic pairs trading literature (e.g., Gatev et al.'s distance method), adapted for single-asset execution via Z-score thresholds. For optimal results, ensure the pair exhibits cointegration (test via Engle-Granger if customizing).
This indicator implements a mean-reversion strategy for pairs trading, focusing on divergences between the chart's primary symbol (e.g., QQQ for tech exposure) and a user-specified inverse or correlated secondary symbol (default: SPY for broad market proxy). It generates long-only entry and exit signals on the primary asset based on statistical deviations in their relative pricing, without requiring short positions or direct trading of the secondary symbol.
Core Concepts
Pairs Mean Reversion: The strategy exploits temporary mispricings in cointegrated assets. When the primary asset becomes "cheap" relative to the secondary (oversold spread), it enters a long position expecting convergence. Exits occur when the spread reverts to neutral or overbought levels.
Spread & Z-Score: The raw spread is calculated as Primary Close - (Hedge Ratio × Secondary Close), with a fixed hedge ratio of 1.5 to approximate relative volatility (e.g., beta adjustment). This is normalized to a Z-score over a lookback period, measuring deviations in standard deviations from the historical mean. Bounds (default ±2.0) define oversold/overbought thresholds—common in statistical arbitrage for 95% confidence intervals assuming normality.
ATR-Based Risk Controls: Entry levels incorporate Average True Range (ATR, default 14-period RMA smoothing) to set dynamic take-profit (TP = Entry + Upper Bound × ATR) and stop-loss (SL = Entry - |Lower Bound| × ATR) levels, scaling to volatility.
Signal Logic
Buy (Long Entry): Triggers when the Z-score crosses above the lower bound (-2.0) after entering an oversold state (Z < lower bound). This signals undervaluation of the primary relative to the secondary.
Sell (Exit): Triggers when the Z-score crosses below the upper bound (2.0) after entering an overbought state (Z > upper bound). Optional strict TP/SL enforcement closes positions at predefined levels.
Signals appear as labeled shapes (green BUY below bar, red SELL above). Short horizontal boxes mark TP (green) and SL (red) for visual reference.
Backtesting & Performance Metrics
Simulation Period: Trades only within user-defined start/end dates (default: Jan 2020–Dec 2030).
Position Sizing: Fixed allocation based on initial capital × entry percentage (default 100%), capped by available equity to enforce risk limits. Supports full compounding if desired via code tweak.
Metrics Table: Displays net profit, ROI (including/excluding unrealized P&L), win rate, trade counts, closed capital, total equity, and open position details (shares or current value). Recent trades logged in a separate table.
Equity Floor: Prevents capital from going below zero, simulating real-world drawdown limits.
Usage Guidelines
Symbol Setup: Apply to the primary asset's chart (e.g., QQQ). Set "Inverse Ticker" to a negatively or positively correlated pair (e.g., SPY for market hedge).
Parameter Tuning: Increase lookback (20+) for smoother signals; widen bounds (±3.0) for fewer, higher-conviction trades. Lower entry % reduces risk.
Best Practices: Use on daily/4H timeframes for swing trades. Combine with overall market trend filters. Backtest across regimes (e.g., bull/bear) to validate.
Limitations: Assumes mean reversion holds; performs poorly in trending divergences. No commissions/slippage modeled—adjust initial capital accordingly.
This approach draws from classic pairs trading literature (e.g., Gatev et al.'s distance method), adapted for single-asset execution via Z-score thresholds. For optimal results, ensure the pair exhibits cointegration (test via Engle-Granger if customizing).
仅限邀请脚本
只有作者授权的用户才能访问此脚本。您需要申请并获得使用许可。通常情况下,付款后即可获得许可。更多详情,请按照下方作者的说明操作,或直接联系theshrubgardener。
TradingView不建议您付费购买或使用任何脚本,除非您完全信任其作者并了解其工作原理。您也可以在我们的社区脚本找到免费的开源替代方案。
作者的说明
Member access only, contact the Shrub on discord - https://discord.gg/xxDvh6vAwZ
免责声明
这些信息和出版物并非旨在提供,也不构成TradingView提供或认可的任何形式的财务、投资、交易或其他类型的建议或推荐。请阅读使用条款了解更多信息。