PROTECTED SOURCE SCRIPT
已更新 DSKOLI Base
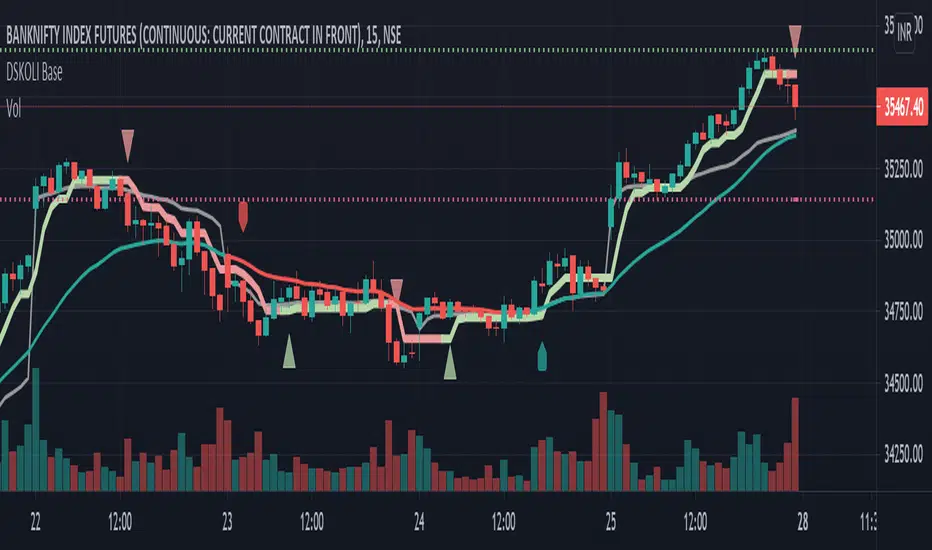
This helps to determine bullish or bearish trend of any chart on any time-frame and good to have for Intraday watch.
Details -
a. Label-Up/Down shows the recent price movement is getting bullish or bearish from zero/neutral base by comparing to previous few candles.
b. EMA line helps to know the price movement of candles are above or below the EMA and its coloured with red and green which even further helps to determine its existing trend.
c. A plot Trend line which is quite close to candles with red and green line and arrow is calculated from few candles' high and low values with some mathematical formulas which along EMA adds more value for trend identification.
d. Recent High/Low automatically plots support and resistance lines on basis of previous swing high or low. An alert is added for any these levels breakout or breakdown.
Note or Disclaimer:
1. This may be considered only for Watching as Learning and informational purpose.
2. Take advice from financial advisor before entering, holding, converting or exiting from any order or trade.
3. Always keep your acceptable stop-loss in all your transactions while trading or investing.
DSKOLI or TradingView reserves all right and don't hold any responsibilities for any loss/losses as well as accuracy of levels or price movement.
版本注释
Buffer percentage points update版本注释
Update版本注释
Update.版本注释
Update.版本注释
Update.Vertical Lines based on calculation of first 5 minute's high or open price with interval counting from 09:00 or 09:15.
Horizontal Lines based on calculation of yesterday's close, yesterday's high/low or today's open.
版本注释
Update.Removed Vertical Lines based on calculation of first 5 min's high or open price.
版本注释
Update.Vertical Lines based on calculation of first 5 minute's high or open price with interval counting from 09:00 or 09:15.
受保护脚本
此脚本以闭源形式发布。 但是,您可以自由使用,没有任何限制 — 了解更多信息这里。
免责声明
这些信息和出版物并非旨在提供,也不构成TradingView提供或认可的任何形式的财务、投资、交易或其他类型的建议或推荐。请阅读使用条款了解更多信息。
免责声明
这些信息和出版物并非旨在提供,也不构成TradingView提供或认可的任何形式的财务、投资、交易或其他类型的建议或推荐。请阅读使用条款了解更多信息。