OPEN-SOURCE SCRIPT
已更新 TPI
You know who you are.
Use the "Plot" option one indicator at a time to verify that you have the correct time series for each indicator and that the bullish/bearish formula you enter is correct. Only one indicator can be plotted at a time and the best source of validation is the numerical value from the last candle that shows as a highlight in each indicator.
After you have verified that all indicators are correctly set up click on "Use in TPI" and make sure no "Plot" option is selected.
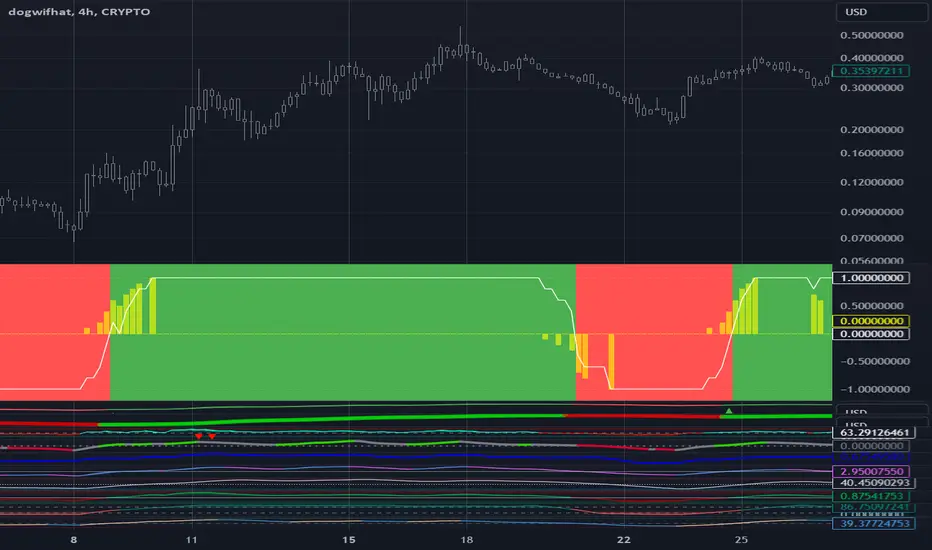
Set the Threshold to "1000" to define the +1/-1 TPI component value by comparing two time series data (usually on perpetual indicators) as opposed to the fixed value in Threshold (usually on oscillators).
Zero range specifies a band around which the difference between the two values will be considered zero. -1 disables it and outputs only +1/-1 values for each component.
Good luck!
Use the "Plot" option one indicator at a time to verify that you have the correct time series for each indicator and that the bullish/bearish formula you enter is correct. Only one indicator can be plotted at a time and the best source of validation is the numerical value from the last candle that shows as a highlight in each indicator.
After you have verified that all indicators are correctly set up click on "Use in TPI" and make sure no "Plot" option is selected.
Set the Threshold to "1000" to define the +1/-1 TPI component value by comparing two time series data (usually on perpetual indicators) as opposed to the fixed value in Threshold (usually on oscillators).
Zero range specifies a band around which the difference between the two values will be considered zero. -1 disables it and outputs only +1/-1 values for each component.
Good luck!
版本注释
You know who you are.Use the "Plot" option one indicator at a time to verify that you have the correct time series for each indicator and that the bullish/bearish formula you enter is correct. Only one indicator can be plotted at a time and the best source of validation is the numerical value from the last candle that shows as a highlight in each indicator.
After you have verified that all indicators are correctly set up click on "Use in TPI" and make sure no "Plot" option is selected.
Set the Threshold to "1000" to define the +1/-1 TPI component value by comparing two time series data (usually on perpetual indicators) as opposed to the fixed value in Threshold (usually on oscillators).
Zero range specifies a band around which the difference between the two values will be considered zero. -1 disables it and outputs only +1/-1 values for each component.
Good luck!
版本注释
Adding -1/+1 lines so that the scale remains the same irrespective of the period.版本注释
Added rate of change and split TPI from signal to better support alert generation版本注释
Added number of bars the TPI has remained at +1 to be used as a strategy input.版本注释
Added the option to have the day of the month on TPI transitions to help in indicator tunning.版本注释
Add the ability to exports TPI transition dates to aid with indicator selection and optimization.版本注释
Fixed error on exported day of the transition date开源脚本
秉承TradingView的精神,该脚本的作者将其开源,以便交易者可以查看和验证其功能。向作者致敬!您可以免费使用该脚本,但请记住,重新发布代码须遵守我们的网站规则。
免责声明
这些信息和出版物并非旨在提供,也不构成TradingView提供或认可的任何形式的财务、投资、交易或其他类型的建议或推荐。请阅读使用条款了解更多信息。
开源脚本
秉承TradingView的精神,该脚本的作者将其开源,以便交易者可以查看和验证其功能。向作者致敬!您可以免费使用该脚本,但请记住,重新发布代码须遵守我们的网站规则。
免责声明
这些信息和出版物并非旨在提供,也不构成TradingView提供或认可的任何形式的财务、投资、交易或其他类型的建议或推荐。请阅读使用条款了解更多信息。