PROTECTED SOURCE SCRIPT
已更新 xGhozt Wickless Candle Streak Probability
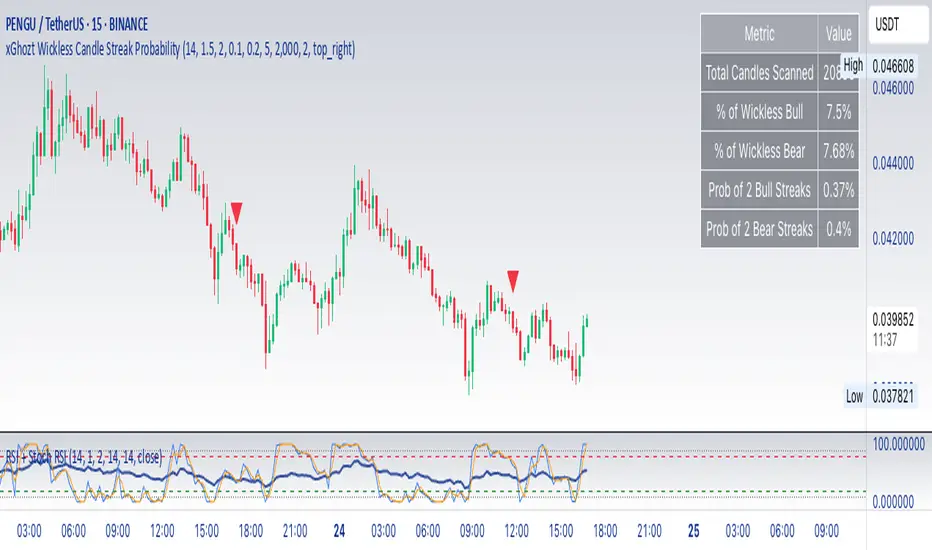
The xGhozt Wickless Candle Streak Probability is a custom Pine Script indicator designed to identify and quantify the occurrence of consecutive "wickless" candles of the same trend (either bullish or bearish).
Key Features:
Wickless Candle Detection: It first identifies candles that lack an upper or lower wick (meaning their open/close is equal to their high/low, respectively).
Consecutive Streak Tracking: The indicator tracks how many wickless bullish candles occur in a row, and similarly for wickless bearish candles.
User-Defined Streak Length: You can specify a Streak Length in the indicator's settings. This defines how many consecutive wickless candles are needed to register a "streak."
Probability Calculation: For the chosen Streak Length, the indicator calculates the historical probability (as a percentage) of encountering such a streak for both bullish and bearish wickless candles. This is done by dividing the number of times a streak of that length has occurred by the total number of candles scanned.
On-Chart Display: The results, including the total wickless candles, total scanned candles, and the calculated streak probabilities, are displayed in a convenient table directly on your chart.
Purpose:
This indicator helps traders and analysts understand the historical likelihood of sustained, strong directional moves as indicated by consecutive wickless candles. By quantifying these probabilities, it can provide insights into potential continuation patterns or extreme market conditions, which might be useful for developing trading strategies or confirming market biases.
版本注释
changed the label icons版本注释
updated numbers table版本注释
updated odds calculations版本注释
Cleaner chart, smaller labels版本注释
Aesthetics changes受保护脚本
此脚本以闭源形式发布。 但是,您可以自由使用,没有任何限制 — 了解更多信息这里。
免责声明
这些信息和出版物并非旨在提供,也不构成TradingView提供或认可的任何形式的财务、投资、交易或其他类型的建议或推荐。请阅读使用条款了解更多信息。
免责声明
这些信息和出版物并非旨在提供,也不构成TradingView提供或认可的任何形式的财务、投资、交易或其他类型的建议或推荐。请阅读使用条款了解更多信息。