INVITE-ONLY SCRIPT
Operator Entry Detector and their Support and resistance Zones
Introduction:
The indicator is designed to detect specific market conditions related to operator entries and identify support and resistance zones.
Developed by Sarangdhar, this version is labeled as Alphatradevission 1.1
Key Features:-
Utilizes Heavy Volume Change to identify operator entry signals.
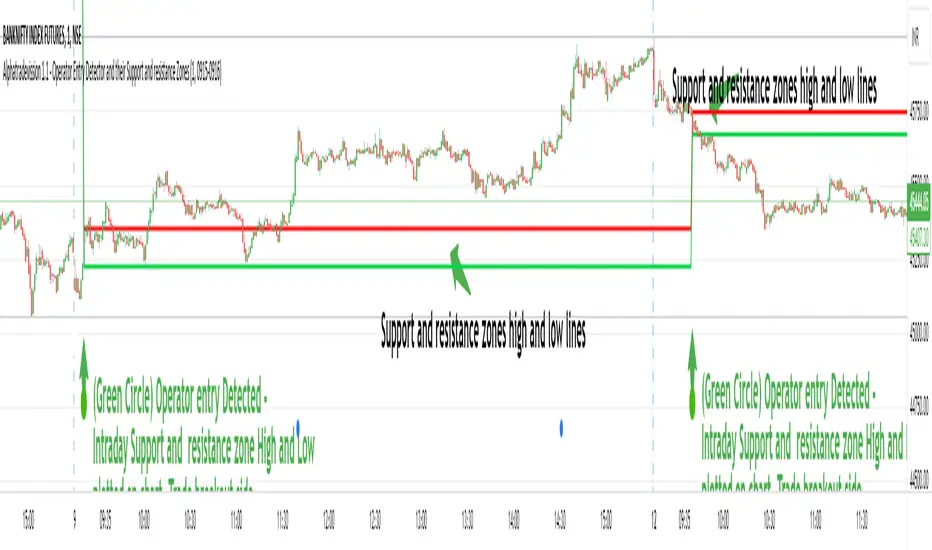
Displays support and resistance zones based on the Specific Calculated Volume Length values.
Highlights potential trend reversal or continuation zones using specific chart patterns and Specific Calculated Volume Change Length values
Settings:
Option to hide/show lines and labels for a cleaner chart presentation.
Defines regular trading hours and considers the 9:15 AM candle for analysis.
Visual Elements:
Uses various shapes and colors to represent different market scenarios:
Circles for the 9:15 AM candle to Understand New Trading Session Started.
Triangles for Volume change signals.
Different colors for distinct VC levels.
Green diamonds with numbering for identified trend starter signals.
Signals and Zones:
Detects specific VC values to signal potential trend starters, small sharks, and big sharks.
Labels support and resistance zones based on the 9:15 AM candle and VC signals.
Highlights reversal and trend continuation zones based on Specific VC length given in script.
Customization:
Traders can adjust input parameters to suit their preferred timeframes and market conditions.
The option to hide/show lines and labels allows users to customize the indicator display.
How users can make profit using this script ?
Usage Tips: Chart 1 min time frame
Users may consider potential trend changes or continuations based on identified VC signals.
Support and resistance zones can be utilized for setting stop-loss or take-profit levels.
1. That zone will act as support and resistance through out day.
5. Trade Breakout direction of that range. As range break market trend start in that direction.
6. If Candle range High break - traders view must be buying the stock with stoploss just below the candle range and vice versa.
Note :-
1. Avoid Fake breakout of candle range . take entry after breakout confirmation. You can take entry after retest to that candle range.
Giving below example of reversal and trend continuation zones high low line by hiding intraday Support and resistance zone lines you can costomize it as per use,
https://www.tradingview.com/x/zabQNvLZ/
The indicator is designed to detect specific market conditions related to operator entries and identify support and resistance zones.
Developed by Sarangdhar, this version is labeled as Alphatradevission 1.1
Key Features:-
Utilizes Heavy Volume Change to identify operator entry signals.
Displays support and resistance zones based on the Specific Calculated Volume Length values.
Highlights potential trend reversal or continuation zones using specific chart patterns and Specific Calculated Volume Change Length values
Settings:
Option to hide/show lines and labels for a cleaner chart presentation.
Defines regular trading hours and considers the 9:15 AM candle for analysis.
Visual Elements:
Uses various shapes and colors to represent different market scenarios:
Circles for the 9:15 AM candle to Understand New Trading Session Started.
Triangles for Volume change signals.
Different colors for distinct VC levels.
Green diamonds with numbering for identified trend starter signals.
Signals and Zones:
Detects specific VC values to signal potential trend starters, small sharks, and big sharks.
Labels support and resistance zones based on the 9:15 AM candle and VC signals.
Highlights reversal and trend continuation zones based on Specific VC length given in script.
Customization:
Traders can adjust input parameters to suit their preferred timeframes and market conditions.
The option to hide/show lines and labels allows users to customize the indicator display.
How users can make profit using this script ?
Usage Tips: Chart 1 min time frame
Users may consider potential trend changes or continuations based on identified VC signals.
Support and resistance zones can be utilized for setting stop-loss or take-profit levels.
1. That zone will act as support and resistance through out day.
5. Trade Breakout direction of that range. As range break market trend start in that direction.
6. If Candle range High break - traders view must be buying the stock with stoploss just below the candle range and vice versa.
Note :-
1. Avoid Fake breakout of candle range . take entry after breakout confirmation. You can take entry after retest to that candle range.
Giving below example of reversal and trend continuation zones high low line by hiding intraday Support and resistance zone lines you can costomize it as per use,
https://www.tradingview.com/x/zabQNvLZ/
仅限邀请脚本
只有作者授权的用户才能访问此脚本。您需要申请并获得使用许可。通常情况下,付款后即可获得许可。更多详情,请按照下方作者的说明操作,或直接联系I_am_Operator_Detector。
TradingView不建议您付费购买或使用任何脚本,除非您完全信任其作者并了解其工作原理。您也可以在我们的社区脚本找到免费的开源替代方案。
作者的说明
contact us. mail on alphatradevission@gmail.com / Text me on my profile
免责声明
这些信息和出版物并非旨在提供,也不构成TradingView提供或认可的任何形式的财务、投资、交易或其他类型的建议或推荐。请阅读使用条款了解更多信息。