PROTECTED SOURCE SCRIPT
已更新 Borjas Tarh Explosive Pivots

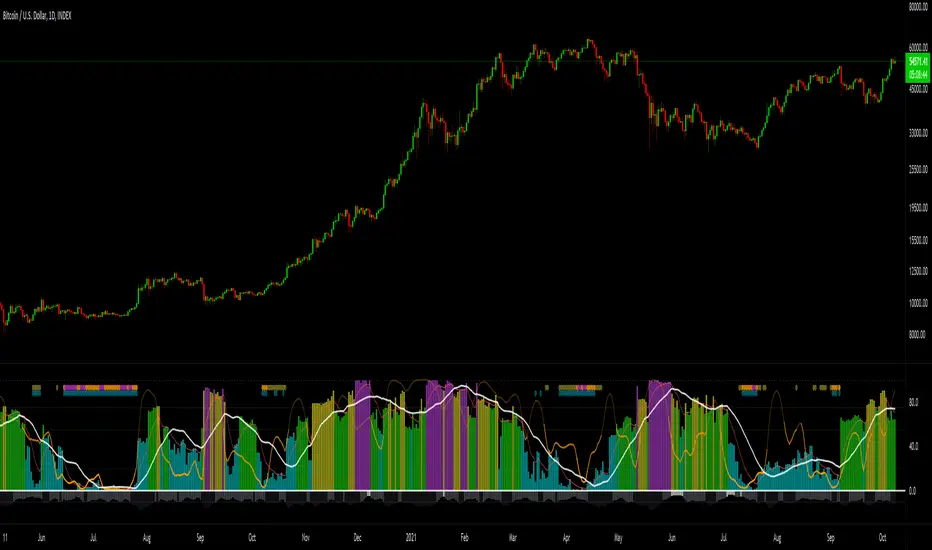
Borjas Tarh Explosive Pivots
This indicator includes:
1. Historical Volatility Percentile (HVP) +SMA+EMA
Core Idea (balipour):
HVP Code Help (semiotic): tradingview.com/u/semiotic
For the Detailed Description read the Core (HVP) Idea indicator by "balipour" above.
2. Bollinger Bands Width (BBW)
It's an Oscillation of BBW So it's trapped between 0 to 100. (And Lightly Smoothed)
3. Volume Oscillator
The Volume is oscillated so it's trapped between 0 and -30. (And Lightly Smoothed)
Below 10 Means the Volume in the context of the Candle Volume is pretty low.
4. The Shapes
These Shapes are based of all factors above.
D (Blue) : HVPis pretty Low. An Explosive Move is Coming.
A (Yellow) : An Explosive Move is Building Up.
B (Orange) : An Explosive Move is Near.
C (Purple) : An Explosive Move Will Happen Very Soon.
There is an Alternative Set:
On = Annual HVP and Default BBW.
Off = Fibonacci HVP and BBW.
© mrhashem
© Borjas Tarh Company
This indicator includes:
1. Historical Volatility Percentile (HVP) +SMA+EMA
Core Idea (balipour):

HVP Code Help (semiotic): tradingview.com/u/semiotic
For the Detailed Description read the Core (HVP) Idea indicator by "balipour" above.
2. Bollinger Bands Width (BBW)
It's an Oscillation of BBW So it's trapped between 0 to 100. (And Lightly Smoothed)
3. Volume Oscillator
The Volume is oscillated so it's trapped between 0 and -30. (And Lightly Smoothed)
Below 10 Means the Volume in the context of the Candle Volume is pretty low.
4. The Shapes
These Shapes are based of all factors above.
D (Blue) : HVPis pretty Low. An Explosive Move is Coming.
A (Yellow) : An Explosive Move is Building Up.
B (Orange) : An Explosive Move is Near.
C (Purple) : An Explosive Move Will Happen Very Soon.
There is an Alternative Set:
On = Annual HVP and Default BBW.
Off = Fibonacci HVP and BBW.
© mrhashem
© Borjas Tarh Company
版本注释
Settings Updated.版本注释
Style Update.版本注释
Added 2 types of Smoothing:Options:
No Smoothing
Lite Smoothing
Heavy Smoothing
Source Update. Code Tweaks.
版本注释
Updated BBW Formula.Updated Code Styling.
版本注释
Updated to v5 Pinescript.受保护脚本
此脚本以闭源形式发布。 但是,您可以自由使用,没有任何限制 — 了解更多信息这里。
免责声明
这些信息和出版物并非旨在提供,也不构成TradingView提供或认可的任何形式的财务、投资、交易或其他类型的建议或推荐。请阅读使用条款了解更多信息。
受保护脚本
此脚本以闭源形式发布。 但是,您可以自由使用,没有任何限制 — 了解更多信息这里。
免责声明
这些信息和出版物并非旨在提供,也不构成TradingView提供或认可的任何形式的财务、投资、交易或其他类型的建议或推荐。请阅读使用条款了解更多信息。