OPEN-SOURCE SCRIPT
Wyckoff Volume Color
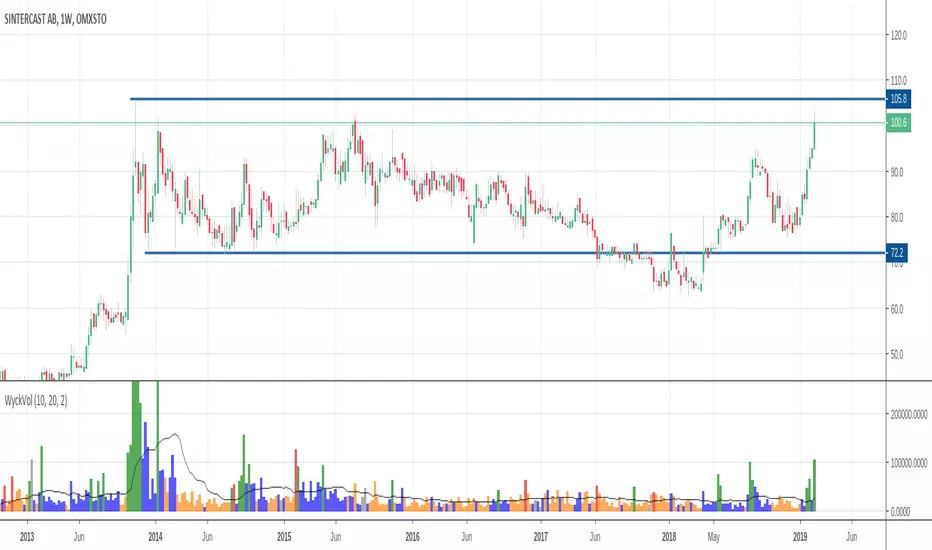
This volume indicator is intended to be used for the Wyckoff strategy.
Green volume bar indicates last price close above close 10 days ago together with volume larger than 2 * SMA(volume, 20)
Blue volume bar indicates last price close above close 10 days ago together with volume less than 2 * SMA(volume, 20)
Orange volume bar indicates last price close lower than close 10 days ago together with volume less than 2 * SMA(volume, 20)
Red volume bar indicates last price close lower than close 10 days ago together with volume larger than 2 * SMA(volume, 20)
The main purpose is to have green bars with a buying climax and red bars with a selling climax.
Three variables can be changed by simply pressing the settings button.
How many days back the closing price is compared to. Now 10 days.
How many times the SMA(volume) is multiplied by. Now times 2.
How many days the SMA(volume) consists by. Now 20 days.
开源脚本
秉承TradingView的精神,该脚本的作者将其开源,以便交易者可以查看和验证其功能。向作者致敬!您可以免费使用该脚本,但请记住,重新发布代码须遵守我们的网站规则。
免责声明
这些信息和出版物并非旨在提供,也不构成TradingView提供或认可的任何形式的财务、投资、交易或其他类型的建议或推荐。请阅读使用条款了解更多信息。
开源脚本
秉承TradingView的精神,该脚本的作者将其开源,以便交易者可以查看和验证其功能。向作者致敬!您可以免费使用该脚本,但请记住,重新发布代码须遵守我们的网站规则。
免责声明
这些信息和出版物并非旨在提供,也不构成TradingView提供或认可的任何形式的财务、投资、交易或其他类型的建议或推荐。请阅读使用条款了解更多信息。