INVITE-ONLY SCRIPT
Batman Signal
BATMAN SIGNAL: Identify Potential Reversal Patterns
The Batman Signal is designed to help spot potential reversal patterns that may indicate institutional activity at key price levels. It looks for a distinct "double rejection" structure, with the crucial second rejection accompanied by a liquidity spike (high volume), suggesting significant market participation.
🔑 KEY FEATURES
• Dynamic Support & Resistance Zones: Automatically calculates and draws key zones on your chart, giving an at-a-glance view of major price reaction levels where 'Batman' patterns are most likely to form.
• Momentum Clusters: See market bias instantly. Clusters of green or red dots in the top margin show where bullish or bearish patterns are actively forming. Nested purple diamonds within these clusters highlight high-volume liquidity spikes. Increasing concentration here can provide an early warning for the next major setup.
• Four Powerful, Independent Alerts: Each alert is a robust signal engineered to catch market turns. Use them separately or in sequence based on your style.
• Non-Repainting, Close-Based Signals: All final confirmation triangles plot ONLY AFTER the bar closes, providing dependable execution signals.
• Volume-Spike Confirmation: Core logic identifies "liquidity spikes" (high volume) at key rejection areas, filtering for significant market participation.
• Full Customization: Tune every aspect from trend sensitivity, zone detection, volume filters, pattern timing and structure to match any asset or timeframe.
🦇 THE FOUR BATMAN SIGNALS
The indicator scans for a specific "double rejection" structure:
• "Left Ear" – initial rejection at a key zone.
• "Right Ear" – volume-confirmed rejection at a similar level.
This creates four distinct, non-repainting alerts:
Bullish Right Ear Alert – Early warning at support.
Bearish Right Ear Alert – Early warning at resistance.
Confirmed Bullish Batman Signal – Final trigger after bar close.
Confirmed Bearish Batman Signal – Final trigger after bar close.
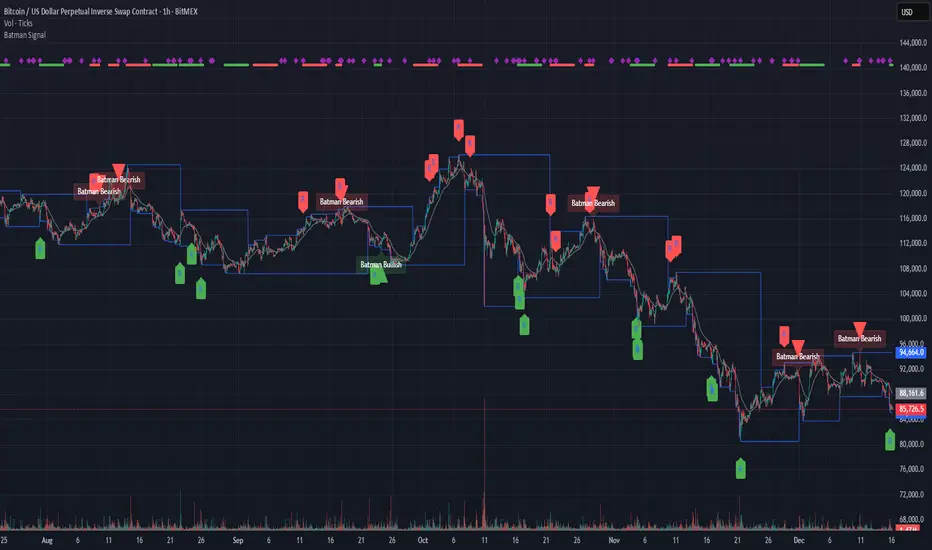
HOW TO READ THE CHART:
• Blue Lines – Dynamic support/resistance zones.
• "R" Labels & Purple Diamonds – Mark developing Right Ear rejections with volume spike.
• Green/Red Triangles – Show the confirmed, final Batman pattern signal.
• Clusters of Green/Red Dots – Show active bullish/bearish pattern zones (top margin).
• Nested Purple Diamonds – Highlight high-volume spikes within clusters.
• Gray EMA – Provides trend context.
⚙️ CUSTOMIZABLE INPUTS
Trend & Zones:
– Trend EMA Period – Adjust baseline trend sensitivity.
– Key Zone Lookback – Set how far back to scan for key levels.
– Zone Tolerance % – Fine-tune the zone width.
Pattern Logic:
– Min/Max Consolidation Bars – Control time window between Left and Right Ear.
– Min Wick Ratio for Right Ear – Filter for strong rejection wicks.
– Min Spike Size (ATR) – Set minimum volatility for the Right Ear.
Volume Filter (Right Ear Only):
– Toggle volume confirmation on/off.
– Volume Lookback Period – Bars used for average volume calculation.
– Min Volume Ratio – Right Ear volume must be this many times above average.
Visual Settings:
– Show/Hide labels and key zones.
– Customize bullish, bearish, and zone colors.
📘 HOW TO TRADE WITH IT
Apply the "Batman Signal" to your chart.
Watch price action at the blue zones and monitor the top-margin dot clusters for active momentum. Nested purple diamonds signal volume spikes.
Set alerts for your preferred signal type (Right Ear for early warning, or final Batman Signal for confirmation).
Alerts are robust and will fire on bar after print.
ALWAYS use sound risk management—define stop-loss and take-profit levels.
Recommended timeframes: 15min and 1 hour for optimal balance.
Works on all timeframes with appropriate tuning.
🔔 IMPORTANT ALERT SETUP TIP
When you change any input setting (e.g., Min Spike Size, Volume Filter), you MUST delete any existing alerts and create new ones.
TradingView saves alerts as a static snapshot of your settings at creation.
This ensures your alerts always match the strategy you see on the chart.
DISCLAIMER:
Note: This indicator is for informational purposes only and does not constitute financial advice.
Users are encouraged to backtest thoroughly and evaluate the indicator's performance in their trading strategy.
The Batman Signal is designed to help spot potential reversal patterns that may indicate institutional activity at key price levels. It looks for a distinct "double rejection" structure, with the crucial second rejection accompanied by a liquidity spike (high volume), suggesting significant market participation.
🔑 KEY FEATURES
• Dynamic Support & Resistance Zones: Automatically calculates and draws key zones on your chart, giving an at-a-glance view of major price reaction levels where 'Batman' patterns are most likely to form.
• Momentum Clusters: See market bias instantly. Clusters of green or red dots in the top margin show where bullish or bearish patterns are actively forming. Nested purple diamonds within these clusters highlight high-volume liquidity spikes. Increasing concentration here can provide an early warning for the next major setup.
• Four Powerful, Independent Alerts: Each alert is a robust signal engineered to catch market turns. Use them separately or in sequence based on your style.
• Non-Repainting, Close-Based Signals: All final confirmation triangles plot ONLY AFTER the bar closes, providing dependable execution signals.
• Volume-Spike Confirmation: Core logic identifies "liquidity spikes" (high volume) at key rejection areas, filtering for significant market participation.
• Full Customization: Tune every aspect from trend sensitivity, zone detection, volume filters, pattern timing and structure to match any asset or timeframe.
🦇 THE FOUR BATMAN SIGNALS
The indicator scans for a specific "double rejection" structure:
• "Left Ear" – initial rejection at a key zone.
• "Right Ear" – volume-confirmed rejection at a similar level.
This creates four distinct, non-repainting alerts:
Bullish Right Ear Alert – Early warning at support.
Bearish Right Ear Alert – Early warning at resistance.
Confirmed Bullish Batman Signal – Final trigger after bar close.
Confirmed Bearish Batman Signal – Final trigger after bar close.
HOW TO READ THE CHART:
• Blue Lines – Dynamic support/resistance zones.
• "R" Labels & Purple Diamonds – Mark developing Right Ear rejections with volume spike.
• Green/Red Triangles – Show the confirmed, final Batman pattern signal.
• Clusters of Green/Red Dots – Show active bullish/bearish pattern zones (top margin).
• Nested Purple Diamonds – Highlight high-volume spikes within clusters.
• Gray EMA – Provides trend context.
⚙️ CUSTOMIZABLE INPUTS
Trend & Zones:
– Trend EMA Period – Adjust baseline trend sensitivity.
– Key Zone Lookback – Set how far back to scan for key levels.
– Zone Tolerance % – Fine-tune the zone width.
Pattern Logic:
– Min/Max Consolidation Bars – Control time window between Left and Right Ear.
– Min Wick Ratio for Right Ear – Filter for strong rejection wicks.
– Min Spike Size (ATR) – Set minimum volatility for the Right Ear.
Volume Filter (Right Ear Only):
– Toggle volume confirmation on/off.
– Volume Lookback Period – Bars used for average volume calculation.
– Min Volume Ratio – Right Ear volume must be this many times above average.
Visual Settings:
– Show/Hide labels and key zones.
– Customize bullish, bearish, and zone colors.
📘 HOW TO TRADE WITH IT
Apply the "Batman Signal" to your chart.
Watch price action at the blue zones and monitor the top-margin dot clusters for active momentum. Nested purple diamonds signal volume spikes.
Set alerts for your preferred signal type (Right Ear for early warning, or final Batman Signal for confirmation).
Alerts are robust and will fire on bar after print.
ALWAYS use sound risk management—define stop-loss and take-profit levels.
Recommended timeframes: 15min and 1 hour for optimal balance.
Works on all timeframes with appropriate tuning.
🔔 IMPORTANT ALERT SETUP TIP
When you change any input setting (e.g., Min Spike Size, Volume Filter), you MUST delete any existing alerts and create new ones.
TradingView saves alerts as a static snapshot of your settings at creation.
This ensures your alerts always match the strategy you see on the chart.
DISCLAIMER:
Note: This indicator is for informational purposes only and does not constitute financial advice.
Users are encouraged to backtest thoroughly and evaluate the indicator's performance in their trading strategy.
仅限邀请脚本
只有作者授权的用户才能访问此脚本。您需要申请并获得使用许可。通常情况下,付款后即可获得许可。更多详情,请按照下方作者的说明操作,或直接联系GreenIce_Firefall。
TradingView不建议您付费购买或使用任何脚本,除非您完全信任其作者并了解其工作原理。您也可以在我们的社区脚本找到免费的开源替代方案。
作者的说明
Email me at greenicefirefall@gmail.com
免责声明
这些信息和出版物并非旨在提供,也不构成TradingView提供或认可的任何形式的财务、投资、交易或其他类型的建议或推荐。请阅读使用条款了解更多信息。
仅限邀请脚本
只有作者授权的用户才能访问此脚本。您需要申请并获得使用许可。通常情况下,付款后即可获得许可。更多详情,请按照下方作者的说明操作,或直接联系GreenIce_Firefall。
TradingView不建议您付费购买或使用任何脚本,除非您完全信任其作者并了解其工作原理。您也可以在我们的社区脚本找到免费的开源替代方案。
作者的说明
Email me at greenicefirefall@gmail.com
免责声明
这些信息和出版物并非旨在提供,也不构成TradingView提供或认可的任何形式的财务、投资、交易或其他类型的建议或推荐。请阅读使用条款了解更多信息。