OPEN-SOURCE SCRIPT
已更新 Omega_galsky
The strategy uses three Exponential Moving Averages (EMAs) — EMA8, EMA21, and EMA89 — to decide when to open buy or sell trades. It also includes a mechanism to move the Stop Loss (SL) to the Break-Even (BE) point, which is the entry price, once the price reaches a Risk-to-Reward (R2R) ratio of 1:1.
Key Steps:
Calculating EMAs: The script computes the EMA values for the specified periods. These help identify market trends and potential entry points.
Buy Conditions:
EMA8 crosses above EMA21.
The candle that causes the crossover is green (closing price is higher than the opening price).
The closing price is above EMA89.
If all conditions are met, a buy order is executed.
Sell Conditions:
EMA8 crosses below EMA21.
The candle that causes the crossover is red (closing price is lower than the opening price).
The closing price is below EMA89.
If all conditions are met, a sell order is executed.
Stop Loss and Take Profit:
Initial Stop Loss and Take Profit levels are calculated based on the entry price and a percentage defined by the user.
These levels help protect against large losses and lock in profits.
Break-Even Logic:
When the price moves favorably to reach a 1:1 R2R ratio:
For a buy trade, the Stop Loss is moved to the entry price if the price increases sufficiently.
For a sell trade, the Stop Loss is moved to the entry price if the price decreases sufficiently.
This ensures the trade is risk-free after the price reaches the predefined level.
Visual Representation:
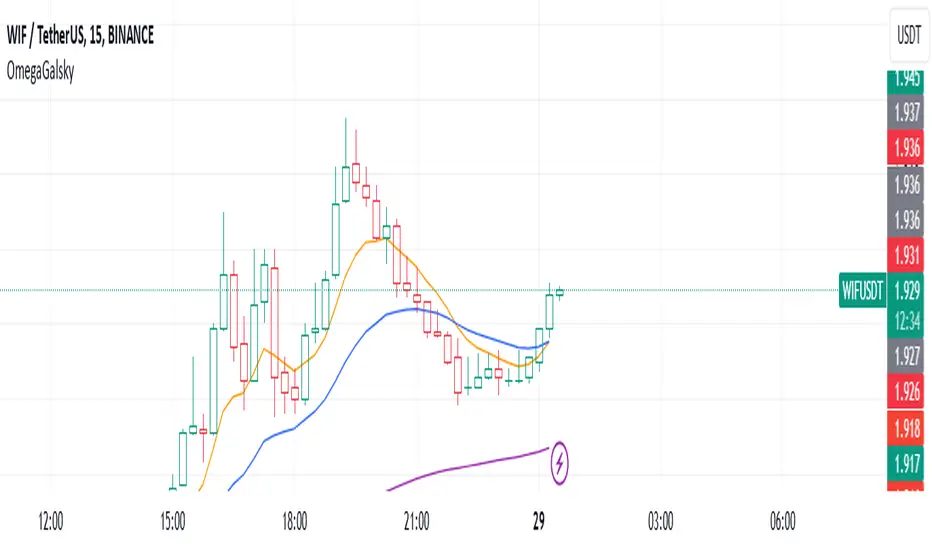
The EMAs are plotted on the chart for easy visualization of trends and crossovers.
Entry and exit points are also marked on the chart to track trades.
Purpose:
The strategy is designed to capitalize on EMA crossovers while minimizing risks using Break-Even logic and predefined Stop Loss/Take Profit levels. It automates decision-making for trend-following traders and ensures disciplined risk management.
Key Steps:
Calculating EMAs: The script computes the EMA values for the specified periods. These help identify market trends and potential entry points.
Buy Conditions:
EMA8 crosses above EMA21.
The candle that causes the crossover is green (closing price is higher than the opening price).
The closing price is above EMA89.
If all conditions are met, a buy order is executed.
Sell Conditions:
EMA8 crosses below EMA21.
The candle that causes the crossover is red (closing price is lower than the opening price).
The closing price is below EMA89.
If all conditions are met, a sell order is executed.
Stop Loss and Take Profit:
Initial Stop Loss and Take Profit levels are calculated based on the entry price and a percentage defined by the user.
These levels help protect against large losses and lock in profits.
Break-Even Logic:
When the price moves favorably to reach a 1:1 R2R ratio:
For a buy trade, the Stop Loss is moved to the entry price if the price increases sufficiently.
For a sell trade, the Stop Loss is moved to the entry price if the price decreases sufficiently.
This ensures the trade is risk-free after the price reaches the predefined level.
Visual Representation:
The EMAs are plotted on the chart for easy visualization of trends and crossovers.
Entry and exit points are also marked on the chart to track trades.
Purpose:
The strategy is designed to capitalize on EMA crossovers while minimizing risks using Break-Even logic and predefined Stop Loss/Take Profit levels. It automates decision-making for trend-following traders and ensures disciplined risk management.
版本注释
The strategy uses three Exponential Moving Averages (EMAs) — EMA8, EMA21, and EMA89 — to decide when to open buy or sell trades. It also includes a mechanism to move the Stop Loss (SL) to the Break-Even (BE) point, which is the entry price, once the price reaches a Risk-to-Reward (R2R) ratio of 1:1.Key Steps:
Calculating EMAs: The script computes the EMA values for the specified periods. These help identify market trends and potential entry points.
Buy Conditions:
EMA8 crosses above EMA21.
The candle that causes the crossover is green (closing price is higher than the opening price).
The closing price is above EMA89.
If all conditions are met, a buy order is executed.
Sell Conditions:
EMA8 crosses below EMA21.
The candle that causes the crossover is red (closing price is lower than the opening price).
The closing price is below EMA89.
If all conditions are met, a sell order is executed.
Stop Loss and Take Profit:
Initial Stop Loss and Take Profit levels are calculated based on the entry price and a percentage defined by the user.
These levels help protect against large losses and lock in profits.
Break-Even Logic:
When the price moves favorably to reach a 1:1 R2R ratio:
For a buy trade, the Stop Loss is moved to the entry price if the price increases sufficiently.
For a sell trade, the Stop Loss is moved to the entry price if the price decreases sufficiently.
This ensures the trade is risk-free after the price reaches the predefined level.
Visual Representation:
The EMAs are plotted on the chart for easy visualization of trends and crossovers.
Entry and exit points are also marked on the chart to track trades.
Purpose:
The strategy is designed to capitalize on EMA crossovers while minimizing risks using Break-Even logic and predefined Stop Loss/Take Profit levels. It automates decision-making for trend-following traders and ensures disciplined risk management.
开源脚本
秉承TradingView的精神,该脚本的作者将其开源,以便交易者可以查看和验证其功能。向作者致敬!您可以免费使用该脚本,但请记住,重新发布代码须遵守我们的网站规则。
免责声明
这些信息和出版物并非旨在提供,也不构成TradingView提供或认可的任何形式的财务、投资、交易或其他类型的建议或推荐。请阅读使用条款了解更多信息。
免责声明
这些信息和出版物并非旨在提供,也不构成TradingView提供或认可的任何形式的财务、投资、交易或其他类型的建议或推荐。请阅读使用条款了解更多信息。