OPEN-SOURCE SCRIPT
Market Phases (ZigZag + MA + RSI)
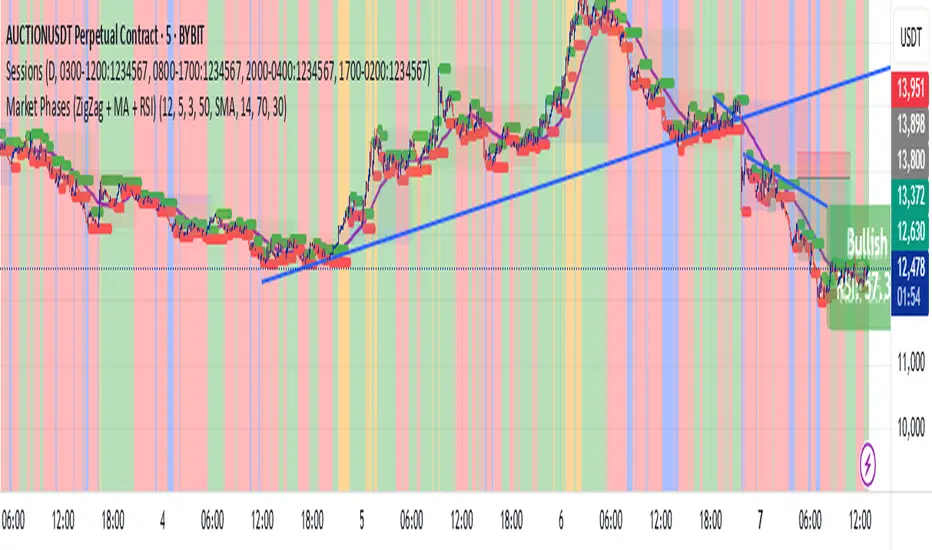
This script is a TradingView Pine Script that visualizes market phases using the ZigZag pattern, Moving Averages (MA), and the Relative Strength Index (RSI). It allows traders to identify key market conditions, such as accumulating, distributing, bullish, and bearish phases based on price movements and momentum indicators.
#### Components
1. ZigZag Settings:
- Depth: Controls the sensitivity of the ZigZag indicator. A higher value results in fewer price points being considered as reversals.
- Deviation: Defines the minimum percentage change needed to identify a ZigZag point, preventing small fluctuations from being registered.
- Backstep: Specifies the number of bars to look back for identifying highs and lows.
2. Moving Average Settings:
- MA Length: The number of periods used to calculate the moving average.
- MA Type: The type of moving average to use, either Simple Moving Average (SMA) or Exponential Moving Average (EMA).
3. RSI Settings:
- RSI Length: The period for calculating the RSI.
- Overbought Level: The threshold above which the asset is considered overbought.
- Oversold Level: The threshold below which the asset is considered oversold.
4. Calculations:
- Moving Average and RSI Calculation: The script calculates either an SMA or EMA and the RSI based on user-defined settings.
5. ZigZag Enhanced Calculation:
- It identifies swing highs and lows to determine the ZigZag points for improved trend analysis.
6. Trend Direction:
- The script checks the direction of the trend based on the latest ZigZag points.
7. Market Phase Determination:
- The script defines the market phase (Accumulation, Distribution, Bullish, Bearish) based on the trend direction and levels from the RSI and relationship with the moving average.
8. Background Colors:
- The background is tinted according to the identified market phase for visual clarity.
9. Labels and Plotting:
- Labels are generated at the last bar with the current phase and RSI value.
- The moving average and last ZigZag points are plotted on the chart for further reference.
### Conclusion
This script provides a comprehensive view of market conditions by integrating multiple indicators, helping traders make informed trading decisions based on market dynamics. The ability to visualize phases and key indicators aids in recognizing potential entry and exit points in trading strategies.
If you have any questions or need further modifications, feel free to ask!
开源脚本
秉承TradingView的精神,该脚本的作者将其开源,以便交易者可以查看和验证其功能。向作者致敬!您可以免费使用该脚本,但请记住,重新发布代码须遵守我们的网站规则。
免责声明
这些信息和出版物并非旨在提供,也不构成TradingView提供或认可的任何形式的财务、投资、交易或其他类型的建议或推荐。请阅读使用条款了解更多信息。
免责声明
这些信息和出版物并非旨在提供,也不构成TradingView提供或认可的任何形式的财务、投资、交易或其他类型的建议或推荐。请阅读使用条款了解更多信息。