PROTECTED SOURCE SCRIPT
已更新 Market Balance
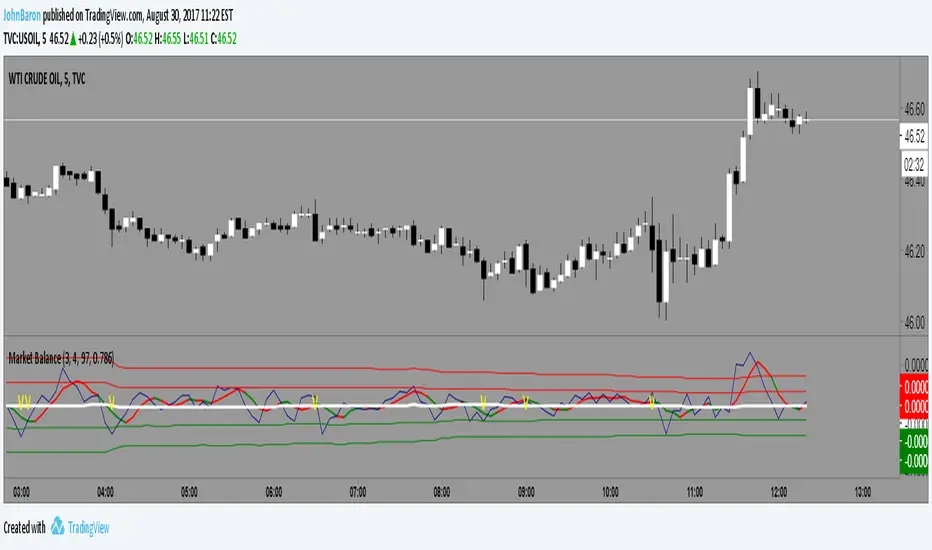
This indicator simply tracks the balance of the supply/demand and will always revert to the mean.
If the market is over bought it will move above the mean, hit a limit and come back toward the mean. Opposite for oversold.
The difference between this and MFI or RSI is that a market can move up or down in an organized fashion and stay close to the mean. It is impulsive moves up or down that will correct.
So a trader might be able to gauge whether an given stock has the likelihood to pullback or bounce based on this indicator.
The color indicator attempts to predict the color of the next bar.
Works well with Heiken Ashi style candles as well.
版本注释
Added .. balance zone版本注释
Some small aesthetics.Note, the color indicator on the moving average is a prediction of the next bar color.
受保护脚本
此脚本以闭源形式发布。 但是,您可以自由使用,没有任何限制 — 了解更多信息这里。
免责声明
这些信息和出版物并非旨在提供,也不构成TradingView提供或认可的任何形式的财务、投资、交易或其他类型的建议或推荐。请阅读使用条款了解更多信息。
免责声明
这些信息和出版物并非旨在提供,也不构成TradingView提供或认可的任何形式的财务、投资、交易或其他类型的建议或推荐。请阅读使用条款了解更多信息。