OPEN-SOURCE SCRIPT
已更新 Renko Chart Emulation
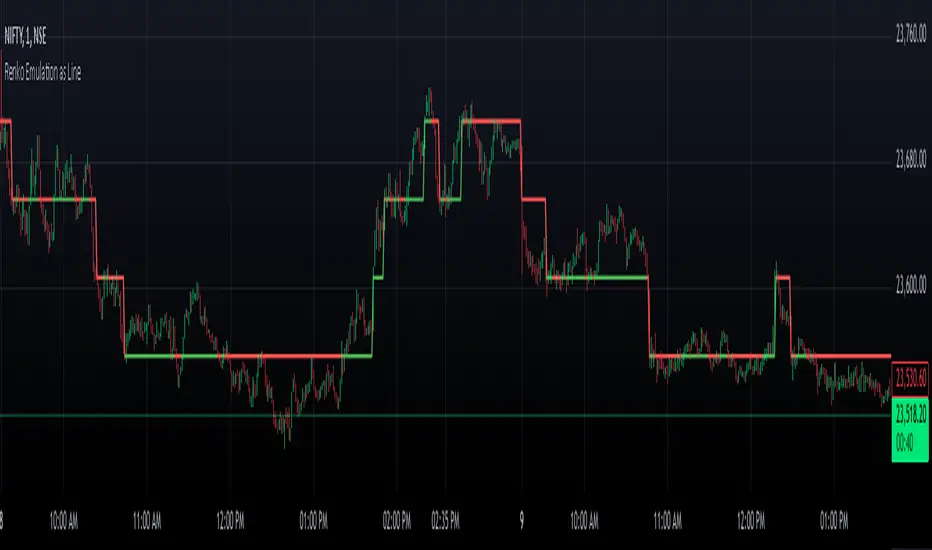
Renko charts are a popular tool in technical analysis, known for their ability to filter out market noise and focus purely on price movements. Unlike traditional candlestick or bar charts, Renko charts are not time-based but are constructed using bricks that represent a fixed price movement. This makes them particularly useful for identifying trends and key levels of support and resistance. While Renko charts are commonly found on platforms with specialized charting capabilities, they can also be emulated in Pine Script as a line indicator.
The Renko emulation indicator in Pine Script calculates the movement of price based on a user-defined brick size. Whenever the price moves up or down by an amount equal to or greater than the brick size, a new level is plotted, indicating a shift in price direction. This approach helps traders visualize significant price moves without the distractions of smaller fluctuations. By plotting the Renko levels as a continuous line and coloring it based on direction, this indicator provides a clean and straightforward representation of market trends.
Traders can use this Renko emulation line to identify potential entry and exit points, as well as to confirm ongoing trends. The simplicity of Renko charts makes them a favorite among those who prefer a minimalist approach to technical analysis. However, it is essential to choose an appropriate brick size that aligns with the volatility of the trading instrument. A smaller brick size may result in frequent signals, while a larger one can smooth out the chart, focusing only on the most substantial price movements. This script offers a flexible solution for incorporating Renko-style analysis into any trading strategy.
版本注释
Overlay fixed开源脚本
秉承TradingView的精神,该脚本的作者将其开源,以便交易者可以查看和验证其功能。向作者致敬!您可以免费使用该脚本,但请记住,重新发布代码须遵守我们的网站规则。
免责声明
这些信息和出版物并非旨在提供,也不构成TradingView提供或认可的任何形式的财务、投资、交易或其他类型的建议或推荐。请阅读使用条款了解更多信息。
免责声明
这些信息和出版物并非旨在提供,也不构成TradingView提供或认可的任何形式的财务、投资、交易或其他类型的建议或推荐。请阅读使用条款了解更多信息。