INVITE-ONLY SCRIPT
KD Momentum Matrix
I believe many traders think that fluctuation is very troublesome. The money earned in the trends is easily lost in the fluctuation. Because it is hard to find the high and low points of range.
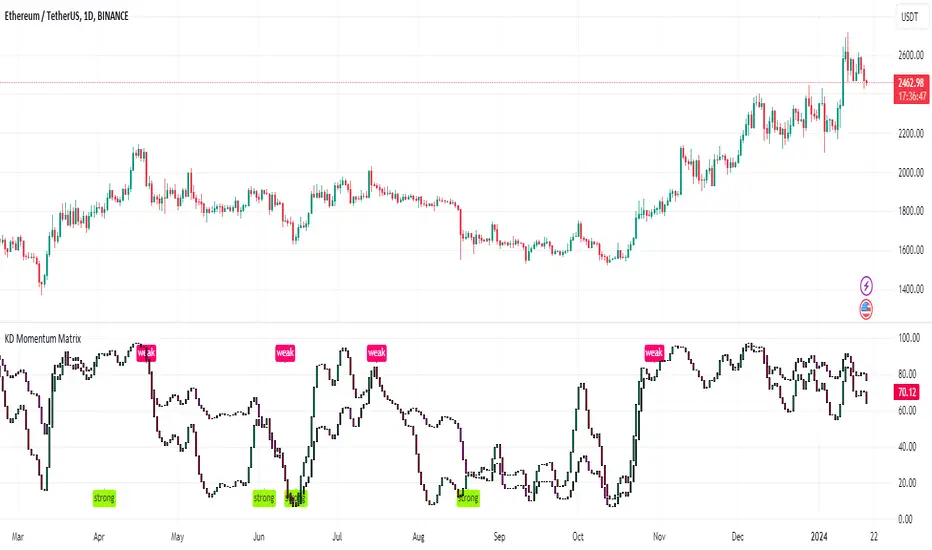
Indicator: KD Momentum Matrix is the best choice for analyzing fluctuation, with potential volatility reminder.
KD Momentum Matrix is not only a momentum indicator, but also a short-term indicator. It divides the movement of the candle into long and short term trends, as well as bullish and bearish momentum. It identifies the points where the bullish and bearish momentum increases and weakens, and effectively capture profits.
💠Usage:
Potential volatility reminder:
"strong" represents an increase in potential volatility, indicating that the fluctuation of the candles may increase in the future.
"weak" represents a decrease in potential volatility, indicating that the fluctuation of the candles may decrease in the future.

Momentum column:
·The short-term momentum column, the "green and red columns", represents the short-term bullish and bearish momentum, and is the main reference feature of this indicator.
·Long term momentum columns, known as "dark green and purple columns", represent long-term bullish and bearish momentum and serve as auxiliary reference feature.
Note: Long and short term momentum columns usually have the same direction, and in rare cases, they may deviate. Sometimes there may be overlapping long and short term columns. The reference bullish and bearish directions are consistent regardless of the long and short term.

🎈Tip I:
When there is a potential volatility reminder: "weak" or "strong", it is important to note that there may be something different on amplitude of fluctuation in the future. If you have a position, you need to think new about the direction of your position.
🎈Tip II:
Taking the main reference feature - the short-term momentum column as an example, when the momentum column changes from red to green, it indicates short-term bullishness, and there may be a small upward trend. If the price happens to be near the bottom of the visible range at this time, consider executing a round of opening long positions or closing short positions.
When holding a long position, the bearish signal indicated by the momentum bar is used for departure, i.e. the momentum bar changes from green to red.

🎈Advanced tip I:
Deviation. The long and short term momentum columns are mostly consistent, but occasionally there may be deviations, indicating intense competition between bulls and bears. In the short term, it is recommended not to engage in trading because of its high uncertainty.

🎈Advanced tip II:
Volatility indicators can also be used in trends, but it is important to remember the idea of following the trend. For example, when there is a callback during an upward trend, we choose to buy or add a long position when the momentum bar becomes a long signal.

*The signals in the indicators are for reference only and not intended as investment advice. Past performance of a strategy is not indicative of future earnings results.
Update -
Optimize the alarm function. If you need to monitor the "strong " or "weak" signal, when creating an alarm, set the condition bar to:
KD Momentum Matrix --> "strong " or "weak" --> Crossing Up --> value -> 1
Indicator: KD Momentum Matrix is the best choice for analyzing fluctuation, with potential volatility reminder.
KD Momentum Matrix is not only a momentum indicator, but also a short-term indicator. It divides the movement of the candle into long and short term trends, as well as bullish and bearish momentum. It identifies the points where the bullish and bearish momentum increases and weakens, and effectively capture profits.
💠Usage:
Potential volatility reminder:
"strong" represents an increase in potential volatility, indicating that the fluctuation of the candles may increase in the future.
"weak" represents a decrease in potential volatility, indicating that the fluctuation of the candles may decrease in the future.
Momentum column:
·The short-term momentum column, the "green and red columns", represents the short-term bullish and bearish momentum, and is the main reference feature of this indicator.
·Long term momentum columns, known as "dark green and purple columns", represent long-term bullish and bearish momentum and serve as auxiliary reference feature.
Note: Long and short term momentum columns usually have the same direction, and in rare cases, they may deviate. Sometimes there may be overlapping long and short term columns. The reference bullish and bearish directions are consistent regardless of the long and short term.
🎈Tip I:
When there is a potential volatility reminder: "weak" or "strong", it is important to note that there may be something different on amplitude of fluctuation in the future. If you have a position, you need to think new about the direction of your position.
🎈Tip II:
Taking the main reference feature - the short-term momentum column as an example, when the momentum column changes from red to green, it indicates short-term bullishness, and there may be a small upward trend. If the price happens to be near the bottom of the visible range at this time, consider executing a round of opening long positions or closing short positions.
When holding a long position, the bearish signal indicated by the momentum bar is used for departure, i.e. the momentum bar changes from green to red.
🎈Advanced tip I:
Deviation. The long and short term momentum columns are mostly consistent, but occasionally there may be deviations, indicating intense competition between bulls and bears. In the short term, it is recommended not to engage in trading because of its high uncertainty.
🎈Advanced tip II:
Volatility indicators can also be used in trends, but it is important to remember the idea of following the trend. For example, when there is a callback during an upward trend, we choose to buy or add a long position when the momentum bar becomes a long signal.
*The signals in the indicators are for reference only and not intended as investment advice. Past performance of a strategy is not indicative of future earnings results.
Update -
Optimize the alarm function. If you need to monitor the "strong " or "weak" signal, when creating an alarm, set the condition bar to:
KD Momentum Matrix --> "strong " or "weak" --> Crossing Up --> value -> 1
仅限邀请脚本
只有作者授权的用户才能访问此脚本。您需要申请并获得使用许可。通常情况下,付款后即可获得许可。更多详情,请按照下方作者的说明操作,或直接联系sypool-AI-TradeGenius。
TradingView不建议您付费购买或使用任何脚本,除非您完全信任其作者并了解其工作原理。您也可以在我们的社区脚本找到免费的开源替代方案。
作者的说明
Sypool is a comprehensive decentralized asset management platform, that provides users with AI trading strategies, trading insights, and so on.
免责声明
这些信息和出版物并非旨在提供,也不构成TradingView提供或认可的任何形式的财务、投资、交易或其他类型的建议或推荐。请阅读使用条款了解更多信息。