INVITE-ONLY SCRIPT
Dudes Multi Time-Frame Pivot System [[Up Only]]

Dudes Multi Time-Frame Pivot System [[Up Only]]
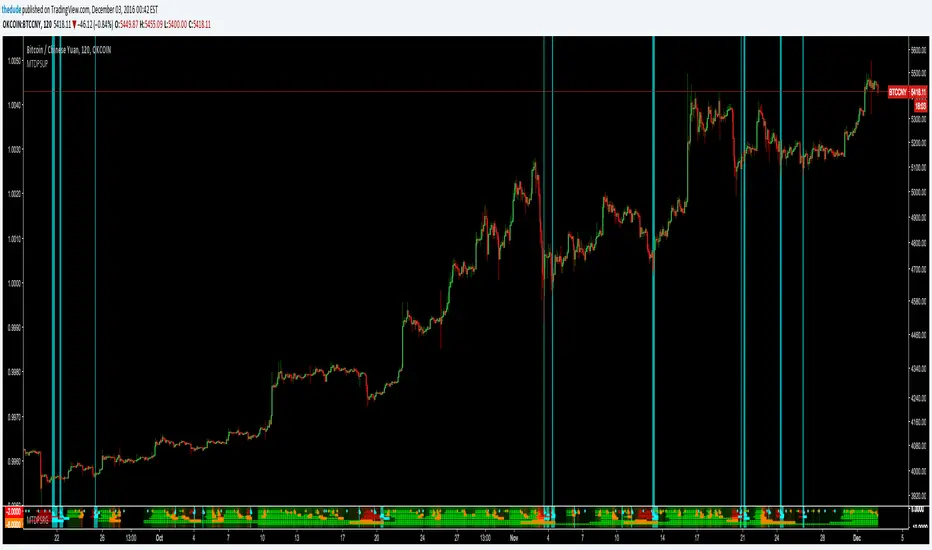
This is the first public beta of a new "ribbon" type of indicator which shows trend information and pivot candle information for 8 different timeframes, all within a very compact and visually appealing space.
It is extremely useful for pinpointing trend changes or current trend by giving you information from 8 different timeframes on one chart. The idea is if multiple time-frames are in sync with each other, the stronger the signal will be. You can easily set alarms on pivot points to trigger Tradingview to send an email or SMS when an important signal appears on the chart. To trigger the alarm, set the indicator to "Cross Up" on the value 0.5. The value of the variable holding candle data is a binary 0 or 1.
The ribbon strategy is split into 3 different indicators because of the large amount of code required to calculate everything. Please contact me if you are interested in purchasing a subscription to the strategy or want more information. The current subscription price is starting at $50USD on a monthly basis. There will be 2 other shared scripts for the other 2 parts of this indicator; Down and Red/Green. Contact me here on tradingview via PM, or via email thedudeontv@gmail.com if you are interested
免责声明
这些信息和出版物并非旨在提供,也不构成TradingView提供或认可的任何形式的财务、投资、交易或其他类型的建议或推荐。请阅读使用条款了解更多信息。