OPEN-SOURCE SCRIPT
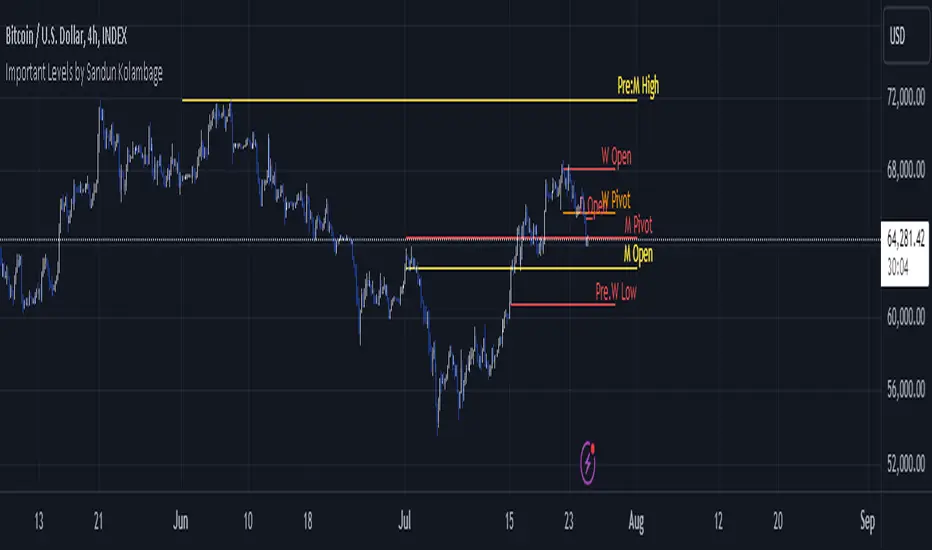
Important Levels by Sandun Kolambage
### Pine Script Indicator: Important Levels by Sandun Kolambage
#### Description
Introducing our new pivot point and high/low indicator for TradingView! This indicator is designed to help traders identify key levels of support and resistance across different timeframes, from daily to yearly. By analyzing historical data and market trends, our indicator displays the most important pivot points and high/low levels, giving you a better understanding of market dynamics and potential trading opportunities.
Whether you're a day trader, swing trader, or long-term investor, our indicator can help you optimize your trading strategy and achieve your financial goals. Install our indicator on TradingView today and start taking advantage of these important levels!
#### Key Features
- **Daily, Weekly, Monthly, and Yearly Levels:** Automatically plots the open, high, low, and close prices for different timeframes to help traders identify significant levels.
- **Pivot Points:** Calculates and displays pivot points for weekly, monthly, and yearly timeframes, providing additional support and resistance levels.
- **Customizable Line Styles:** Offers options to customize the appearance of the lines (solid, dashed, or dotted) for better visualization.
- **Conditional Coloring:** Uses color coding to highlight the relationship between different timeframe closes, making it easy to spot important levels.
#### How It Works
1. **Daily, Weekly, Monthly, and Yearly Levels:**
- The indicator uses `request.security` to fetch and display open, high, low, and close prices for daily, weekly, monthly, and yearly timeframes.
- Lines are plotted at these key levels with colors indicating their relationship to closes of other timeframes.
2. **Pivot Points:**
- Pivot points are calculated using the formula \((High + Low + Close) / 3\).
- These pivot points are plotted on the chart and labeled clearly to indicate potential support and resistance areas.
3. **Customizable Line Styles:**
- Users can select from solid, dashed, or dotted lines to represent the key levels and pivot points for better clarity and personal preference.
4. **Conditional Coloring:**
- The indicator applies conditional coloring to the lines based on the comparison of current close prices across different timeframes. Yellow indicates lower closes, and red indicates higher closes, making it easy to identify important price levels quickly.
#### Usage Instructions
1. **Enable Key Levels:**
- Toggle the "Daily Weekly Monthly High/Low" option to display or hide the respective levels.
- Select your preferred line style (solid, dashed, dotted) for better visibility.
2. **Display Pivot Points:**
- Toggle the "Pivot" option to show or hide the weekly, monthly, and yearly pivot points on the chart.
3. **Interpret Color Coding:**
- Yellow lines indicate levels where the close price is lower compared to a specific timeframe close.
- Red lines indicate levels where the close price is higher compared to a specific timeframe close.
- Specific colors for yearly levels and pivots are used to distinguish them clearly on the chart.
By following these guidelines, traders can effectively use this indicator to identify critical price levels and make informed trading decisions.
开源脚本
秉承TradingView的精神,该脚本的作者将其开源,以便交易者可以查看和验证其功能。向作者致敬!您可以免费使用该脚本,但请记住,重新发布代码须遵守我们的网站规则。
免责声明
这些信息和出版物并非旨在提供,也不构成TradingView提供或认可的任何形式的财务、投资、交易或其他类型的建议或推荐。请阅读使用条款了解更多信息。
开源脚本
秉承TradingView的精神,该脚本的作者将其开源,以便交易者可以查看和验证其功能。向作者致敬!您可以免费使用该脚本,但请记住,重新发布代码须遵守我们的网站规则。
免责声明
这些信息和出版物并非旨在提供,也不构成TradingView提供或认可的任何形式的财务、投资、交易或其他类型的建议或推荐。请阅读使用条款了解更多信息。