INVITE-ONLY SCRIPT
Merek Equal Highs and Lows
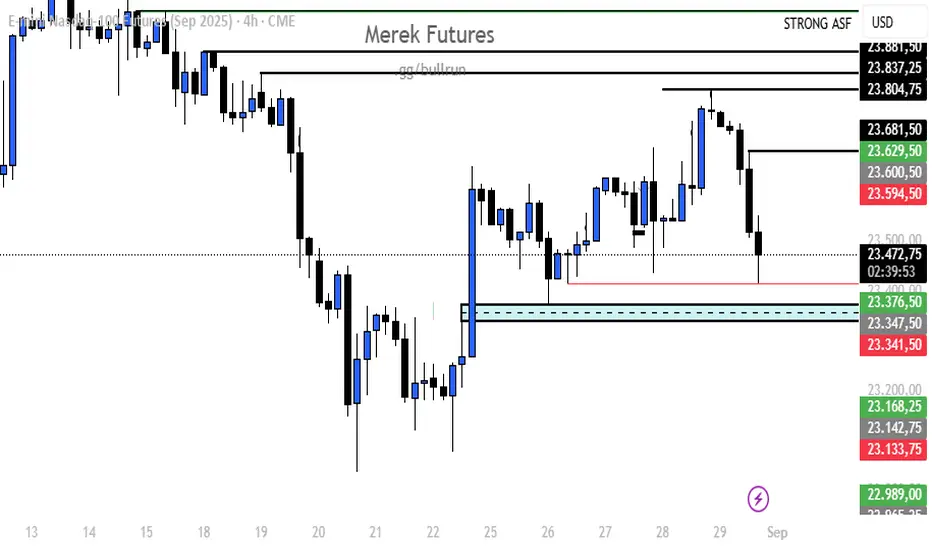
EQH – Equal Highs Indicator
Description:
The EQH indicator detects Equal Highs on the chart. This occurs when price reaches the same high level two or more times without breaking it decisively.
Interpretation:
Liquidity zone: Equal highs are often seen as areas where liquidity (stop-loss clusters) is located.
Breakout potential: A break above this level often signals that liquidity is being taken before either a reversal or continuation of the trend.
Market structure: EQH highlights resistance areas that can serve as key decision points for traders.
Use cases:
Identifying potential stop-hunt zones
Spotting resistance levels
Anticipating liquidity grabs before reversals or trend continuations
EQL – Equal Lows Indicator
Description:
The EQL indicator detects Equal Lows on the chart. This occurs when price reaches the same low level two or more times without breaking lower.
Interpretation:
Liquidity zone: Equal lows are areas where liquidity (sell-side stops) tends to accumulate.
Breakout potential: A move below this level often indicates liquidity being swept before a possible reversal or continuation.
Market structure: EQL highlights support areas that can be critical for trade decisions.
Use cases:
Identifying sell-side liquidity zones
Spotting support levels
Recognizing possible stop-hunts before reversals or trend continuations
Description:
The EQH indicator detects Equal Highs on the chart. This occurs when price reaches the same high level two or more times without breaking it decisively.
Interpretation:
Liquidity zone: Equal highs are often seen as areas where liquidity (stop-loss clusters) is located.
Breakout potential: A break above this level often signals that liquidity is being taken before either a reversal or continuation of the trend.
Market structure: EQH highlights resistance areas that can serve as key decision points for traders.
Use cases:
Identifying potential stop-hunt zones
Spotting resistance levels
Anticipating liquidity grabs before reversals or trend continuations
EQL – Equal Lows Indicator
Description:
The EQL indicator detects Equal Lows on the chart. This occurs when price reaches the same low level two or more times without breaking lower.
Interpretation:
Liquidity zone: Equal lows are areas where liquidity (sell-side stops) tends to accumulate.
Breakout potential: A move below this level often indicates liquidity being swept before a possible reversal or continuation.
Market structure: EQL highlights support areas that can be critical for trade decisions.
Use cases:
Identifying sell-side liquidity zones
Spotting support levels
Recognizing possible stop-hunts before reversals or trend continuations
仅限邀请脚本
只有作者授权的用户才能访问此脚本。您需要申请并获得使用许可。通常情况下,付款后即可获得许可。更多详情,请按照下方作者的说明操作,或直接联系Merek_Real。
TradingView不建议您付费购买或使用任何脚本,除非您完全信任其作者并了解其工作原理。您也可以在我们的社区脚本找到免费的开源替代方案。
作者的说明
EQL and EQH Indicator for free from merek
免责声明
这些信息和出版物并非旨在提供,也不构成TradingView提供或认可的任何形式的财务、投资、交易或其他类型的建议或推荐。请阅读使用条款了解更多信息。
仅限邀请脚本
只有作者授权的用户才能访问此脚本。您需要申请并获得使用许可。通常情况下,付款后即可获得许可。更多详情,请按照下方作者的说明操作,或直接联系Merek_Real。
TradingView不建议您付费购买或使用任何脚本,除非您完全信任其作者并了解其工作原理。您也可以在我们的社区脚本找到免费的开源替代方案。
作者的说明
EQL and EQH Indicator for free from merek
免责声明
这些信息和出版物并非旨在提供,也不构成TradingView提供或认可的任何形式的财务、投资、交易或其他类型的建议或推荐。请阅读使用条款了解更多信息。