INVITE-ONLY SCRIPT
已更新 Aeon Flux

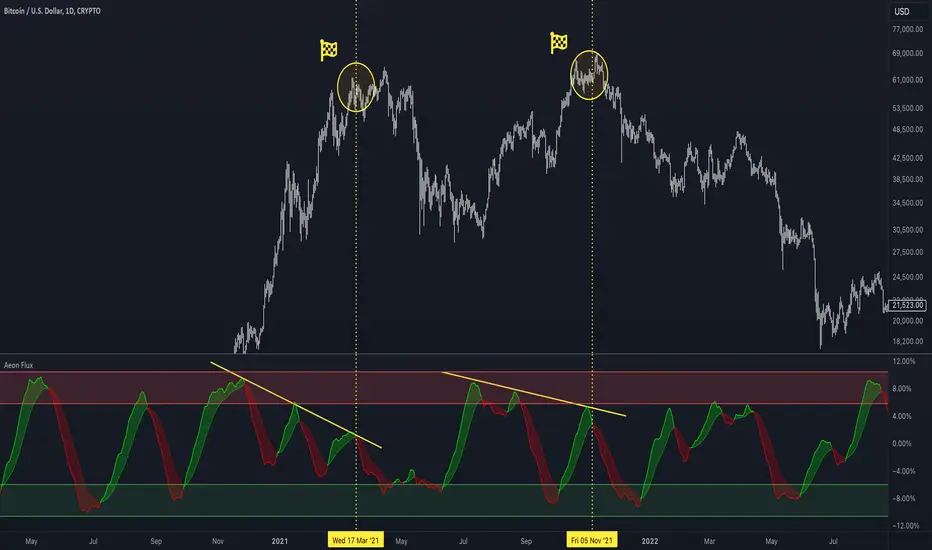
Aeon Flux visualizes rolling cumulative realized volatility, as a signal-generating leading indicator.
'Realized volatility' is shorthand for the metric's true output: entropy. The uniformity (or lack of uniformity) of price and volume distributions over a rolling cumulative period, normalized across the asset's full history.
Entropy = x⋅log2(x)−(1−x)⋅log2(1−x)
AEON FLUX VISUALIZES TIME CYCLES
Aeon Flux distills any asset's cyclical pendulum-like behavior, from bull to bear and vice versa, in a visualization that surfaces and isolates the pendulum shift.
As such, Aeon Flux may be the first metric to automate visualization of time cycles.

Time cycles are a soft science and esoteric concept in markets: an opinion, hard to prove or disprove.
They're ultimately just cycles of accumulation & distribution, that tend to recur at rough consistent intervals.
(Aeon Flux does not measure accumulation & distribution directly, those forces are merely implied.)
ENTROPY AS A LEADING INDICATOR
The transitions between state (from bullish to bearish & vice versa) are often good swing entries & exits, across a wide range of high cap risk markets.

ENTROPY AS A DISTRIBUTION MONITOR
Aeon Flux has a track record of detecting higher timeframe macro distribution on the BTC Index.
The signal: two cycles in a row of lower highs, where the cycle high (the highest oscillator print achieved that cycle) is lower than the previous cycle's high.

Invalidation: if the second cycle in a row of lower highs touches the green AND red target areas on its way up, that demonstrates robust volatility, and the distribution signal is invalidated.
ALERTS & NOTIFICATIONS
Alerts are enabled for swing long & short signals. Automating alerts to monitor distribution are a potential enhancement for future iterations of the script.
'Realized volatility' is shorthand for the metric's true output: entropy. The uniformity (or lack of uniformity) of price and volume distributions over a rolling cumulative period, normalized across the asset's full history.
Entropy = x⋅log2(x)−(1−x)⋅log2(1−x)
AEON FLUX VISUALIZES TIME CYCLES
Aeon Flux distills any asset's cyclical pendulum-like behavior, from bull to bear and vice versa, in a visualization that surfaces and isolates the pendulum shift.
As such, Aeon Flux may be the first metric to automate visualization of time cycles.
Time cycles are a soft science and esoteric concept in markets: an opinion, hard to prove or disprove.
They're ultimately just cycles of accumulation & distribution, that tend to recur at rough consistent intervals.
(Aeon Flux does not measure accumulation & distribution directly, those forces are merely implied.)
ENTROPY AS A LEADING INDICATOR
The transitions between state (from bullish to bearish & vice versa) are often good swing entries & exits, across a wide range of high cap risk markets.
ENTROPY AS A DISTRIBUTION MONITOR
Aeon Flux has a track record of detecting higher timeframe macro distribution on the BTC Index.
The signal: two cycles in a row of lower highs, where the cycle high (the highest oscillator print achieved that cycle) is lower than the previous cycle's high.
Invalidation: if the second cycle in a row of lower highs touches the green AND red target areas on its way up, that demonstrates robust volatility, and the distribution signal is invalidated.
ALERTS & NOTIFICATIONS
Alerts are enabled for swing long & short signals. Automating alerts to monitor distribution are a potential enhancement for future iterations of the script.
版本注释
Minor settings update. Output unaffected.版本注释
Removed the product key.仅限邀请脚本
只有作者授权的用户才能访问此脚本。您需要申请并获得使用许可。通常情况下,付款后即可获得许可。更多详情,请按照下方作者的说明操作,或直接联系AlchemicalIntel。
TradingView不建议您付费购买或使用任何脚本,除非您完全信任其作者并了解其工作原理。您也可以在我们的社区脚本找到免费的开源替代方案。
作者的说明
Access to this script comes included with the Bull Market Top Playbook at https://www.alchemicalintel.com
免责声明
这些信息和出版物并非旨在提供,也不构成TradingView提供或认可的任何形式的财务、投资、交易或其他类型的建议或推荐。请阅读使用条款了解更多信息。
仅限邀请脚本
只有作者授权的用户才能访问此脚本。您需要申请并获得使用许可。通常情况下,付款后即可获得许可。更多详情,请按照下方作者的说明操作,或直接联系AlchemicalIntel。
TradingView不建议您付费购买或使用任何脚本,除非您完全信任其作者并了解其工作原理。您也可以在我们的社区脚本找到免费的开源替代方案。
作者的说明
Access to this script comes included with the Bull Market Top Playbook at https://www.alchemicalintel.com
免责声明
这些信息和出版物并非旨在提供,也不构成TradingView提供或认可的任何形式的财务、投资、交易或其他类型的建议或推荐。请阅读使用条款了解更多信息。