OPEN-SOURCE SCRIPT
Vrext- Advanced EMA Zone
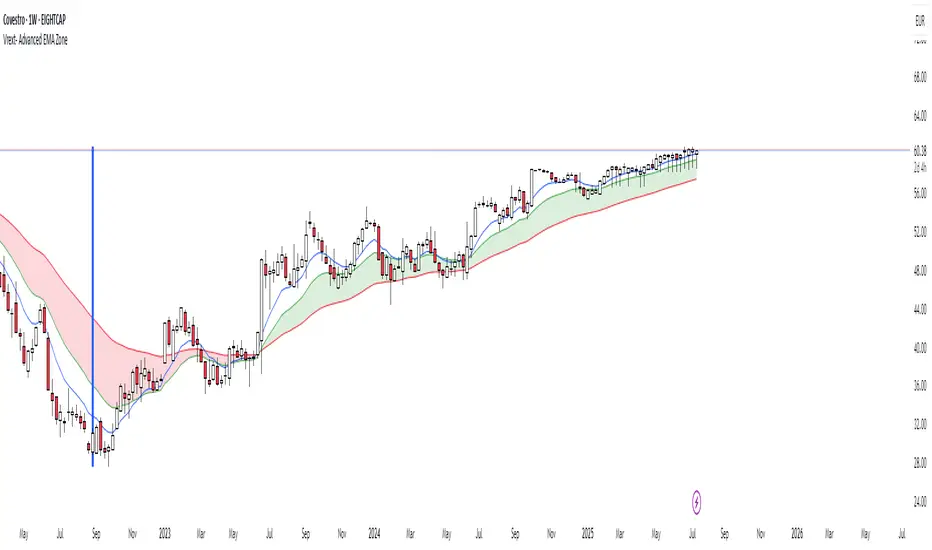
The indicator highlights an area between two manually adjustable EMA-s to visibly mark a zone. A zone where the larger EMA is bellow the smaller one (indicating an uptrend) is marked green. On the opposite hand where higher EMA is above the lower the zone (indicating a downtrend) is marked red.
For correct zone marking enter EMA-s in descending order.
The indicator also allows you to add further additional EMA-s, which do not have a zone drawn between them and are just stand alone EMA-s. They are fully customisable in terms of colour, width. etc.
Additionally the indicator allows you to plot a vertical line ''xyz'' candles in the past. The idea behind it is that if you want to only focus on the previous 150 candles, there will be a clear line at the 150th candle for easier navigating.
开源脚本
秉承TradingView的精神,该脚本的作者将其开源,以便交易者可以查看和验证其功能。向作者致敬!您可以免费使用该脚本,但请记住,重新发布代码须遵守我们的网站规则。
免责声明
这些信息和出版物并非旨在提供,也不构成TradingView提供或认可的任何形式的财务、投资、交易或其他类型的建议或推荐。请阅读使用条款了解更多信息。
免责声明
这些信息和出版物并非旨在提供,也不构成TradingView提供或认可的任何形式的财务、投资、交易或其他类型的建议或推荐。请阅读使用条款了解更多信息。