PROTECTED SOURCE SCRIPT
BB+EMA+TAB by RA
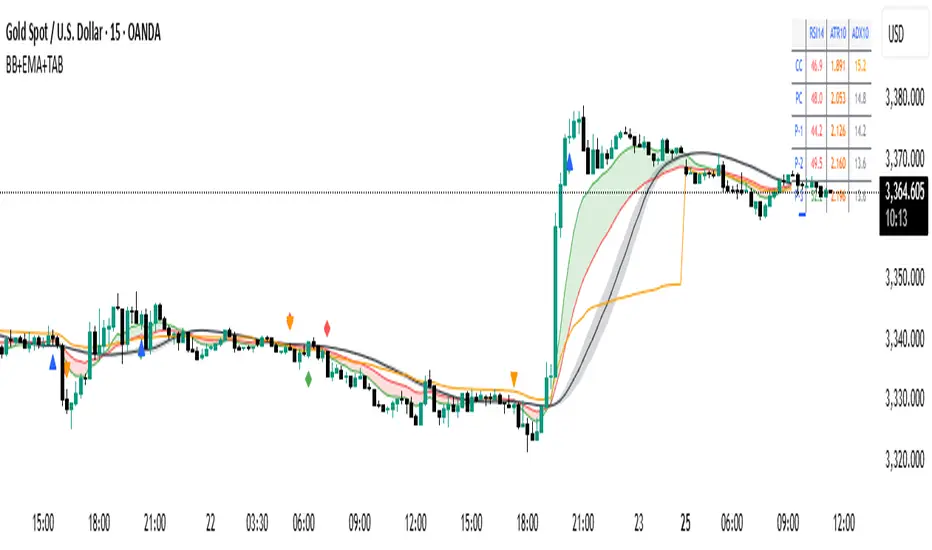
This is EMA based indicator that gives buy/sell signals on the crossover of EMA 1 and EMA 2, also it can fill green /red color between EMA 1 & EMA 2. it also have EMA 3 and EMA 4, which are independent. Bollinger Band (BB) is also there for breakout signals. This indicator also plot a table which shows the values of RSI, ATR, ADX for last 5 candles which helps making trade decisions. RSI values change colors to red/green according to RSI is below/above 50, and ADX values change colors to red/green/grey/orange .. red/green according to EMA 1 and EMA 2 crossover and if ADX value is above 20, grey when ADX value is below 15, orange when ADX value is between 15 and 20 i.e. building momentum. ADX filter is also available in the script.. if on.. then buy/sell signals will be filtered through ADX values as prescribed by the user. This indicator also features HTF EMA crossover filter.. if on .. then buy/sell signals will be aligned with HTF EMA crossover i.e. only buy signals on the chart will come if HTF EMA 1>HTF EMA 2... and only sell signals on the chart will come if HTF EMA 1<HTF EMA 2.
受保护脚本
此脚本以闭源形式发布。 但是,您可以自由使用,没有任何限制 — 了解更多信息这里。
免责声明
这些信息和出版物并非旨在提供,也不构成TradingView提供或认可的任何形式的财务、投资、交易或其他类型的建议或推荐。请阅读使用条款了解更多信息。
受保护脚本
此脚本以闭源形式发布。 但是,您可以自由使用,没有任何限制 — 了解更多信息这里。
免责声明
这些信息和出版物并非旨在提供,也不构成TradingView提供或认可的任何形式的财务、投资、交易或其他类型的建议或推荐。请阅读使用条款了解更多信息。