OPEN-SOURCE SCRIPT
已更新 SMA Ichimoku Crosses
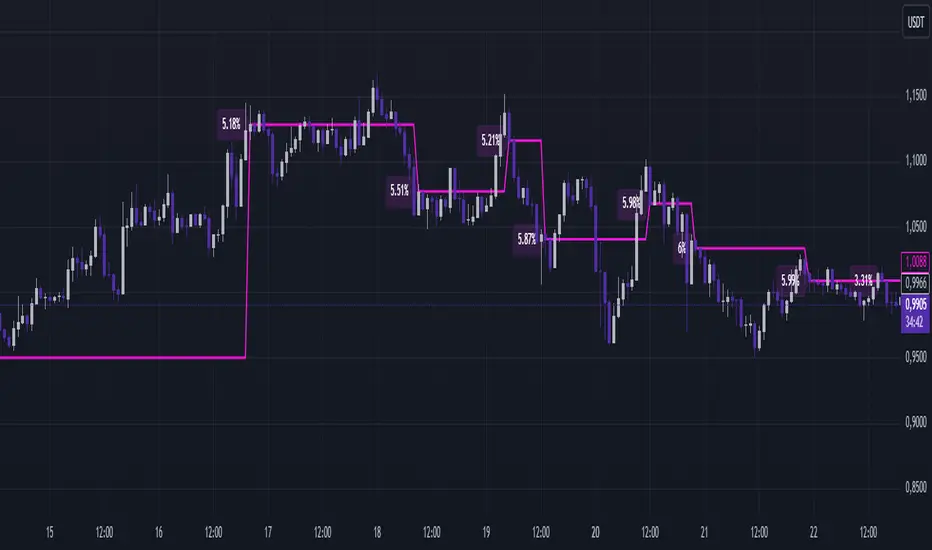
SMA Ichimoku Crosses displays the moving average between the last two crossings of the Tenkan-Sen and Kijun-Sen lines from Ichimoku Kinko Hyo. The line is calculated based on the closing prices at the time of the crossings and is added directly to the price chart, making it a convenient tool for trend analysis and identifying entry and exit points.
Features:
- Automatic calculation of Tenkan-Sen and Kijun-Sen lines.
- Fixation of closing prices at the point of line crossings.
- Calculation of the average price between the last two crossings.
- Display of a pink line on the price chart for convenient analysis.
How to use:
- Identify potential trend reversal zones by observing the line’s position relative to the price.
- Use the line as a dynamic level of support or resistance.
- Include the indicator in your Ichimoku strategies to enhance the accuracy of signals.
Suitable for:
- Traders using Ichimoku in their trading.
- Trend analysis enthusiasts.
- Those looking for additional filters for entry and exit points.
版本注释
Price Maximum Deviation Analysis:Added calculation of the maximum percentage deviation of the price from the SMA (between Ichimoku crosses).
Helps assess volatility and identify potential risk levels.
Deviation History Storage:
Introduced the ability to analyze maximum deviations over recent periods (parameter Number of Breaks).
Deviation data is stored, allowing better analysis of price behavior over time.
Dynamic SMA Update:
The average price (avgPrice) is now fixed at the crossover point and used for subsequent calculations.
This helps to more accurately identify key levels on the chart.
Deviation Labels Display:
At each crossover, the indicator now displays a label showing the average maximum deviation over the selected period.
Provides a clear visual representation of market volatility.
This update makes the indicator more informative and useful for analyzing market conditions.
开源脚本
秉承TradingView的精神,该脚本的作者将其开源,以便交易者可以查看和验证其功能。向作者致敬!您可以免费使用该脚本,但请记住,重新发布代码须遵守我们的网站规则。
免责声明
这些信息和出版物并非旨在提供,也不构成TradingView提供或认可的任何形式的财务、投资、交易或其他类型的建议或推荐。请阅读使用条款了解更多信息。
开源脚本
秉承TradingView的精神,该脚本的作者将其开源,以便交易者可以查看和验证其功能。向作者致敬!您可以免费使用该脚本,但请记住,重新发布代码须遵守我们的网站规则。
免责声明
这些信息和出版物并非旨在提供,也不构成TradingView提供或认可的任何形式的财务、投资、交易或其他类型的建议或推荐。请阅读使用条款了解更多信息。