PROTECTED SOURCE SCRIPT
已更新 Market Breadth - Primary Indicator
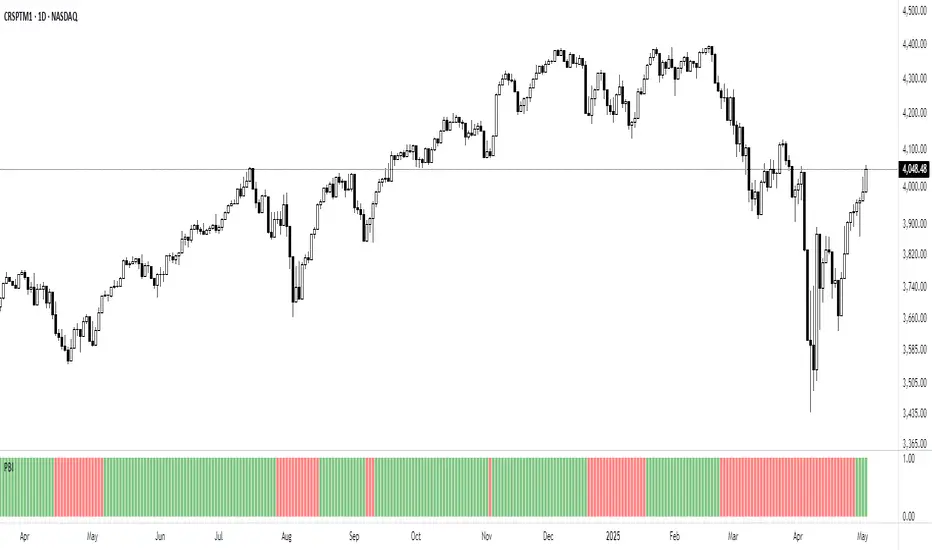
Market Breath is the equilibrium between number of stocks in advance to those in a decline, in other words a method to determine the current market environment. In a positive phase bullish setups will have improved probabilities and presence, whereas in a bearish phase the opposite would be true.
The primary indicator measure the trend in SPY and correlation between different EMA's.
- Green Columns: Positive Breadth
- Red Columns: Negative Breadth
This indicator can be combined with the secondary breadth indicator to further note excessive movement and risk of mean reversion.
The primary indicator measure the trend in SPY and correlation between different EMA's.
- Green Columns: Positive Breadth
- Red Columns: Negative Breadth
This indicator can be combined with the secondary breadth indicator to further note excessive movement and risk of mean reversion.
版本注释
You can now customize which symbol / market the indicator will be based on.版本注释
This version is now based on NASDAQ:CRSPTM1, which tracks the US Total Market Index. This expands coverage to a broader spectrum of U.S. equities.版本注释
Updated chart and color scheme.受保护脚本
此脚本以闭源形式发布。 但是,您可以自由使用,没有任何限制 — 了解更多信息这里。
Technical Trading: Research and Application
stockleave.com/
stockleave.com/
免责声明
这些信息和出版物并非旨在提供,也不构成TradingView提供或认可的任何形式的财务、投资、交易或其他类型的建议或推荐。请阅读使用条款了解更多信息。
受保护脚本
此脚本以闭源形式发布。 但是,您可以自由使用,没有任何限制 — 了解更多信息这里。
Technical Trading: Research and Application
stockleave.com/
stockleave.com/
免责声明
这些信息和出版物并非旨在提供,也不构成TradingView提供或认可的任何形式的财务、投资、交易或其他类型的建议或推荐。请阅读使用条款了解更多信息。