OPEN-SOURCE SCRIPT
已更新 RVOL++
Overview
How to calculate RVOL at Time
For more info about calculating RVOL at time please refer to the Tradingview article.
https://www.tradingview.com/support/solutions/43000635874-how-do-we-calculate-relative-volume-and-relative-volume-at-time/
Key Features of RVOL++
Low RVOL Environment
Neutral RVOL Environment
High RVOL Environment
- RVOL++ is a valuable tool for intraday traders to gauge market participation and anticipate the pace of the market. By understanding the RVOL levels, traders can adjust their strategies and expectations to align with the current market conditions. RVOL is a simple mathematical formula that compares the current volume to a prior lookback period, such as the previous 5 days or previous 10 days. This indicator helps traders understand the level of interest or participation in the market, which in turn can indicate the speed or pace of the market.
How to calculate RVOL at Time
- Check if the current time is within the specified time period (e.g., 9:30 AM to 5:00 PM EST).
- If it is, calculate the current cumulative volume for that period.
- Find the average cumulative volume for the same period over the past X days (where X is the lookback period).
- Calculate the RVOL at Time as:
RVOL at Time =(Current Cumulative Volume/Average Cumulative Volume)×100
For more info about calculating RVOL at time please refer to the Tradingview article.
https://www.tradingview.com/support/solutions/43000635874-how-do-we-calculate-relative-volume-and-relative-volume-at-time/
Key Features of RVOL++
- Two Session and Daily Modes: In Two Session mode, it calculates RVOL for two distinct trading sessions, while in Daily mode, it calculates RVOL for the entire trading day. Two Session mode helps for instruments like futures, forex, crypto that trade 23+ hours. If you are using an instrument such as a stock like AAPL, if you don't have pre-market/extended hours enabled you will want to use "Daily Mode".
- Session Time Settings: The indicator allows users to define the trading session times in Eastern Standard Time (EST) for more accurate RVOL calculations.
- Customizable Lookback Period: Users can set the number of days for the lookback period, allowing for flexibility in calculating the average volume at time (RVOL).
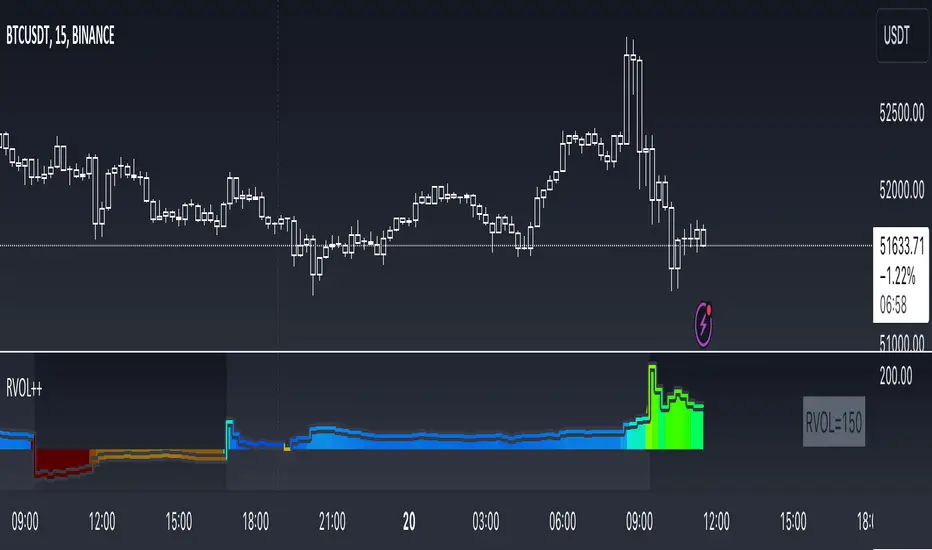
- Color-Coded RVOL Histogram: The indicator displays a color-coded histogram to visualize RVOL levels. Different colors represent different RVOL ranges, making it easy to identify low, neutral, and high RVOL periods.
- RVOL Ranges**: The indicator defines RVOL ranges as follows:
- 40 - 80: Low RVOL (Red/Yellow)
- 80 - 120: Neutral RVOL (Blue/Cyan)
- 120+: High RVOL (Green-Lime)
Low RVOL Environment
- Expect slow market movement with limited opportunities.
- Focus on A+ setups and be selective.
- Use tighter stops, size down, and adjust trading goals.
Neutral RVOL Environment
- Expect a more normalized trading pace with frequent rotations.
- Lean on structure and incorporate other trading tools.
- Use normal sizing and stop management.
High RVOL Environment
- Expect the best opportunities for range expansion and rotations.
- Be more relaxed about overtrading but stay focused on structure.
- Start with smaller initial size and build up to a full position.
版本注释
Add Plotting Styles- Default (old style where RVOL histogram is shown)
- Regular Volume (regular volume columns are shown and rvol coloring is provided by a line at zero)
开源脚本
秉承TradingView的精神,该脚本的作者将其开源,以便交易者可以查看和验证其功能。向作者致敬!您可以免费使用该脚本,但请记住,重新发布代码须遵守我们的网站规则。
免责声明
这些信息和出版物并非旨在提供,也不构成TradingView提供或认可的任何形式的财务、投资、交易或其他类型的建议或推荐。请阅读使用条款了解更多信息。
免责声明
这些信息和出版物并非旨在提供,也不构成TradingView提供或认可的任何形式的财务、投资、交易或其他类型的建议或推荐。请阅读使用条款了解更多信息。