OPEN-SOURCE SCRIPT
MACD HTF - Dynamic Smoothing
Enhancing Your 1-Minute Trades with Dynamic HTF MACD Smoothing
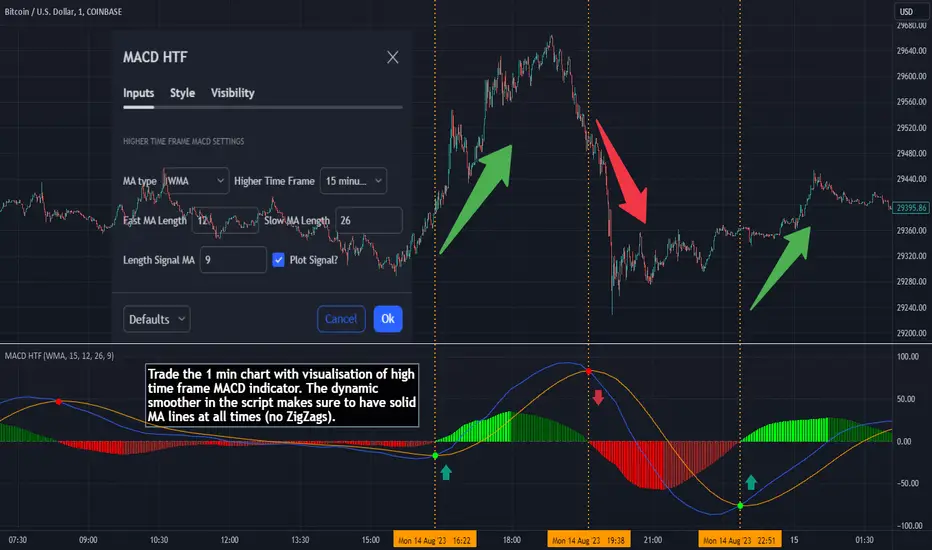
Ever found yourself glued to a 1-minute chart, trying to catch every minor price movement, yet feeling like you're missing the bigger picture? Picture this: a solid MACD line on that chart, dynamically smoothed from a higher timeframe (HTF). This tool offers two significant benefits over other existing HTF MACD indicators:
Understanding the MACD
The Moving Average Convergence Divergence (MACD) is one of the most widely used and trusted technical indicators in the trading community. Invented by Gerald Appel in the late 1970s, the MACD helps traders understand the relationship between two moving averages of a security's price. It consists of the MACD line (difference between a 12-period and 26-period Exponential Moving Average) and the Signal line (9-period EMA of the MACD line). When the MACD line crosses above the Signal line, it's viewed as a bullish signal, and vice versa. The difference between the two lines is represented as a histogram, providing insights into potential buy or sell opportunities.
Features of the Dynamic HTF MACD Smoothing Script
At last
A massive shoutout to all the wizards and generous contributors in the community! You inspire innovations and new tools, paving the path forward. Here's to a community where we learn and build together. Cheers to collective growth!
Ever found yourself glued to a 1-minute chart, trying to catch every minor price movement, yet feeling like you're missing the bigger picture? Picture this: a solid MACD line on that chart, dynamically smoothed from a higher timeframe (HTF). This tool offers two significant benefits over other existing HTF MACD indicators:
- User-Friendly Interface: No need to manually adjust input parameters every time you switch to a different timeframe.
- Smooth Charting: Say goodbye to the zigzag lines that often result from plotting higher time frame resolutions on a lower time frame.
Understanding the MACD
The Moving Average Convergence Divergence (MACD) is one of the most widely used and trusted technical indicators in the trading community. Invented by Gerald Appel in the late 1970s, the MACD helps traders understand the relationship between two moving averages of a security's price. It consists of the MACD line (difference between a 12-period and 26-period Exponential Moving Average) and the Signal line (9-period EMA of the MACD line). When the MACD line crosses above the Signal line, it's viewed as a bullish signal, and vice versa. The difference between the two lines is represented as a histogram, providing insights into potential buy or sell opportunities.
Features of the Dynamic HTF MACD Smoothing Script
- Time Frame Flexibility: Choose a higher timeframe to derive MACD values and apply dynamic smoothing to your current timeframe.
- Multiple Moving Averages: The script supports various MA types like EMA, SMA, DEMA, TEMA, WMA and HMA.
- Alerts: Get real-time alerts for MACD crossover and crossunder.
- Customizability: From the type of moving average to its length, customize as per your strategy.
- Visual Indicators: Clearly plots signals when MACD crossover or crossunder occurs for potential entries.
At last
A massive shoutout to all the wizards and generous contributors in the community! You inspire innovations and new tools, paving the path forward. Here's to a community where we learn and build together. Cheers to collective growth!
开源脚本
秉承TradingView的精神,该脚本的作者将其开源,以便交易者可以查看和验证其功能。向作者致敬!您可以免费使用该脚本,但请记住,重新发布代码须遵守我们的网站规则。
免责声明
这些信息和出版物并非旨在提供,也不构成TradingView提供或认可的任何形式的财务、投资、交易或其他类型的建议或推荐。请阅读使用条款了解更多信息。
免责声明
这些信息和出版物并非旨在提供,也不构成TradingView提供或认可的任何形式的财务、投资、交易或其他类型的建议或推荐。请阅读使用条款了解更多信息。