OPEN-SOURCE SCRIPT
Pipe tops & bottoms v1.0
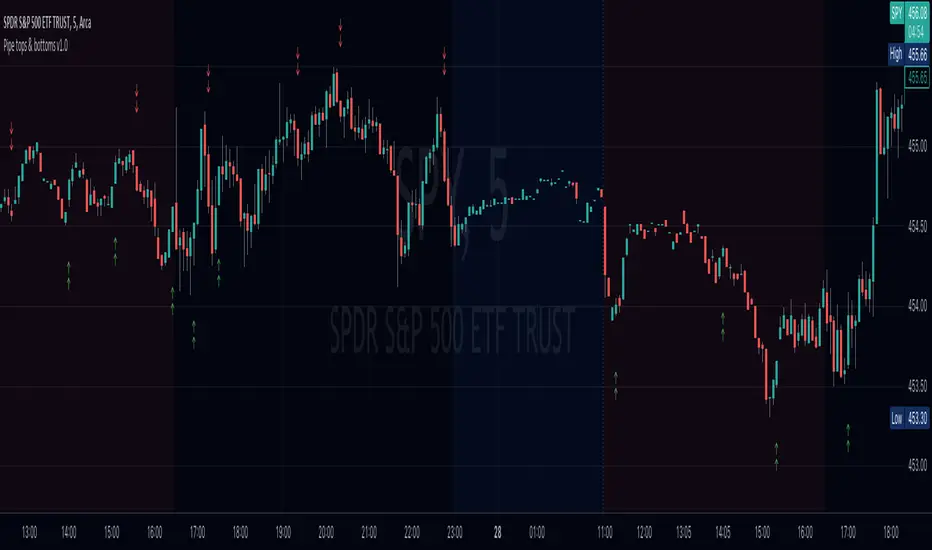
This indicator detects Pipe Tops and Pipe Bottoms chart patterns, using the concept described by Thomas Bulkowski: Tops, Bottoms.
Pipe tops and bottoms patterns are marked on the chart. You can change the indicator sensitivity by using the main settings which define detected price variation boundaries. This will lead to more dense or sparse pattern detection.
Once the bar following each detected top or bottom pattern satisfies signal condition (the current close price must be higher than the high of the pipe bottom, or lower than the low of the pipe top), these bars are also marked on the chart and can be used to define potential long or short entry points.
You can optionally choose to show only signal marks on the chart (this is preferable to avoid visual cluttering), or both pattern and signal marks.
Script calculations are based on the 'Pipe Bottoms Indicator Based on Thomas Bulkowski's Theories' indicator developed by BoilderRoomColdCaller in 2020.
开源脚本
秉承TradingView的精神,该脚本的作者将其开源,以便交易者可以查看和验证其功能。向作者致敬!您可以免费使用该脚本,但请记住,重新发布代码须遵守我们的网站规则。
免责声明
这些信息和出版物并非旨在提供,也不构成TradingView提供或认可的任何形式的财务、投资、交易或其他类型的建议或推荐。请阅读使用条款了解更多信息。
免责声明
这些信息和出版物并非旨在提供,也不构成TradingView提供或认可的任何形式的财务、投资、交易或其他类型的建议或推荐。请阅读使用条款了解更多信息。