OPEN-SOURCE SCRIPT
Time Appliconic Macro | ForTF5m (Fixed)
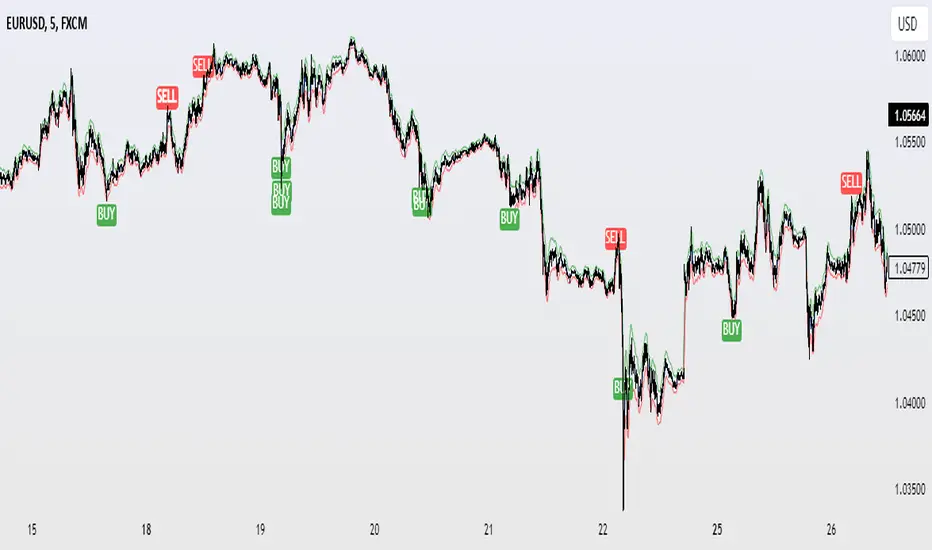
The Time Appliconic Macro (TAMcr) is a custom-built trading indicator designed for the 5-minute time frame (TF5m), providing traders with clear Buy and Sell signals based on precise technical conditions and specific time windows.
Key Features:
Dynamic Moving Average (MA):
The indicator utilizes a Simple Moving Average (SMA) to identify price trends.
Adjustable length for user customization.
Custom STARC Bands:
Upper and lower bands are calculated using the SMA and the Average True Range (ATR).
Includes a user-defined multiplier to adjust the band width for flexibility across different market conditions.
RSI Integration:
Signals are filtered using the Relative Strength Index (RSI), ensuring they align with overbought/oversold conditions.
Time-Based Signal Filtering:
Signals are generated only during specific time windows, allowing traders to focus on high-activity periods or times of personal preference.
Supports multiple custom time ranges with automatic adjustments for UTC-4 or UTC-5 offsets.
Clear Signal Visualization:
Buy Signals: Triggered when the price is below the lower band, RSI indicates oversold conditions, and the time is within the defined range.
Sell Signals: Triggered when the price is above the upper band, RSI indicates overbought conditions, and the time is within the defined range.
Signals are marked directly on the chart for easy identification.
Customizability:
Adjustable parameters for the Moving Average length, ATR length, and ATR multiplier.
Time zone selection and defined trading windows provide a tailored experience for global users.
Who is this Indicator For?
This indicator is perfect for intraday traders who operate in the 5-minute time frame and value clear, filtered signals based on price action, volatility, and momentum indicators. The time window functionality is ideal for traders focusing on specific market sessions or personal schedules.
How to Use:
Adjust the MA and ATR parameters to match your trading style or market conditions.
Set the desired time zone and time ranges to align with your preferred trading hours.
Monitor the chart for Buy (green) and Sell (red) signals, and use them as a guide for entering or exiting trades.
开源脚本
秉承TradingView的精神,该脚本的作者将其开源,以便交易者可以查看和验证其功能。向作者致敬!您可以免费使用该脚本,但请记住,重新发布代码须遵守我们的网站规则。
免责声明
这些信息和出版物并非旨在提供,也不构成TradingView提供或认可的任何形式的财务、投资、交易或其他类型的建议或推荐。请阅读使用条款了解更多信息。
开源脚本
秉承TradingView的精神,该脚本的作者将其开源,以便交易者可以查看和验证其功能。向作者致敬!您可以免费使用该脚本,但请记住,重新发布代码须遵守我们的网站规则。
免责声明
这些信息和出版物并非旨在提供,也不构成TradingView提供或认可的任何形式的财务、投资、交易或其他类型的建议或推荐。请阅读使用条款了解更多信息。