OPEN-SOURCE SCRIPT
已更新 Ultimate Relative Strength
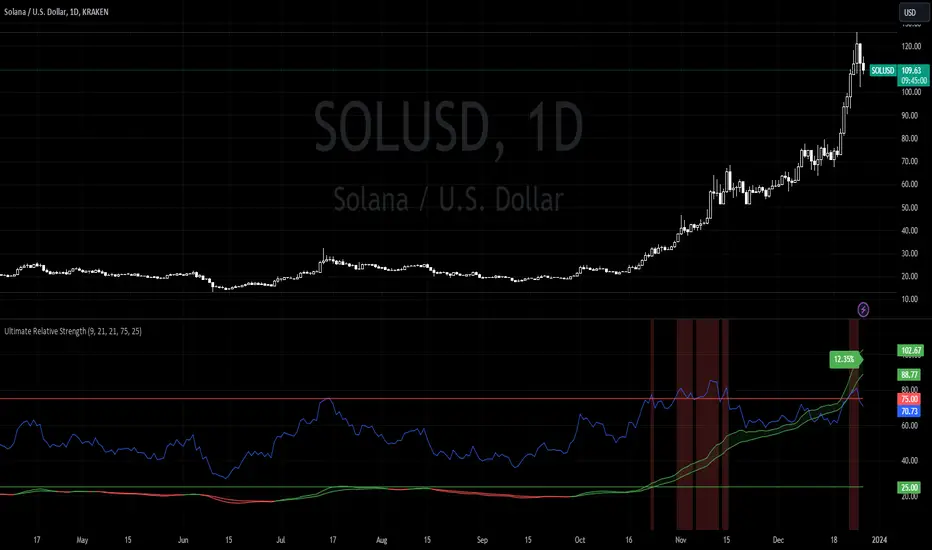
Ema 9 and 21 crossover bands. Green for positive trend, red for negative. It then calculates the distance between the bands and plots the distance as a percentage compared to the overall asset price.
Relative strength index with overbought and oversold levels (customizable). Green columns could be a good place to DCA. Red columns for marking local tops.
By recording the RS % amongst a list of assets, you can determine Salxx's RS Ranking from highest to lowest. A high ranking % inside a red column suggests short term dip or sideways movement. Not the best time to buy in. Monitor until consolidation between overbought and oversold levels. If RS ranking still high, now time to buy in.
版本注释
..版本注释
.开源脚本
秉承TradingView的精神,该脚本的作者将其开源,以便交易者可以查看和验证其功能。向作者致敬!您可以免费使用该脚本,但请记住,重新发布代码须遵守我们的网站规则。
免责声明
这些信息和出版物并非旨在提供,也不构成TradingView提供或认可的任何形式的财务、投资、交易或其他类型的建议或推荐。请阅读使用条款了解更多信息。
免责声明
这些信息和出版物并非旨在提供,也不构成TradingView提供或认可的任何形式的财务、投资、交易或其他类型的建议或推荐。请阅读使用条款了解更多信息。