OPEN-SOURCE SCRIPT
AlphaStrike: Zen Mode
Description:
The Problem most of us lose money because we try to do two opposing things at once: we chase trends when they are already overextended, and we try to catch falling knives before they are ready to bounce. We get chopped up in the middle.
The Solution AlphaStrike is a "Hybrid" system designed to separate these two battlefields. It combines a Trend Following engine (to keep you in big moves) with a Momentum Reversion engine (to spot exhaustion).
It essentially answers two questions:
How It Works (The "Zen" Logic) I stripped away the noise. No clouds, no confusing lines—just the signals that matter.
The Trend Line (Red/Green): This is your bias.
The Circles (Reversals):
The Triangles (Breakouts):
Risk Management (The Built-in Calculator) Trading is math, not magic. This indicator includes a "Smart Risk Table" in the bottom right corner.
Best Settings
Disclaimer: No indicator is perfect. This tool is designed to manage risk and identify probability, not to predict the future. Always use a stop loss.
The Problem most of us lose money because we try to do two opposing things at once: we chase trends when they are already overextended, and we try to catch falling knives before they are ready to bounce. We get chopped up in the middle.
The Solution AlphaStrike is a "Hybrid" system designed to separate these two battlefields. It combines a Trend Following engine (to keep you in big moves) with a Momentum Reversion engine (to spot exhaustion).
It essentially answers two questions:
- "Is the trend my friend?" (Trend Filter)
- "Is the rubber band about to snap?" (Reversal Signal)
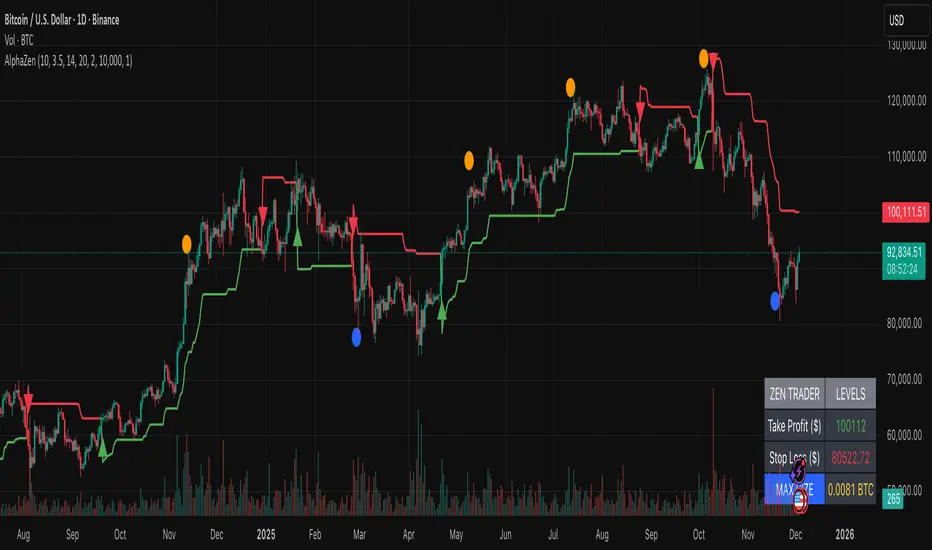
How It Works (The "Zen" Logic) I stripped away the noise. No clouds, no confusing lines—just the signals that matter.
The Trend Line (Red/Green): This is your bias.
- Green: Only look for buys.
- Red: Only look for sells (or cash).
- Rule: Never trade against the line color unless you are scalping a confirmed Reversal Signal.
The Circles (Reversals):
- 🔵 Blue Dot: "Oversold Rejection." Price stretched below the bands and wicked back up. This is a high-reward entry for dips.
- 🟠 Orange Dot: "Overbought Exhaustion." Price stretched too high and was rejected. This is your warning to take profits or tighten stops.
The Triangles (Breakouts):
- Green/Red Triangles: These confirm the trend has officially flipped. This is the safer entry for conservative traders.
Risk Management (The Built-in Calculator) Trading is math, not magic. This indicator includes a "Smart Risk Table" in the bottom right corner.
- It calculates the distance to the structural Stop Loss (invisible support/resistance swings).
- It tells you exactly how much to buy to risk only 1% of your account.
- Note: You must go to Settings and enter your actual Account Size for this to work.
Best Settings
- Crypto (BTC/ETH): Use the default settings (Factor 3.5).
- Forex/Stocks: Lower the Factor to 3.0 for more sensitivity.
Disclaimer: No indicator is perfect. This tool is designed to manage risk and identify probability, not to predict the future. Always use a stop loss.
开源脚本
秉承TradingView的精神,该脚本的作者将其开源,以便交易者可以查看和验证其功能。向作者致敬!您可以免费使用该脚本,但请记住,重新发布代码须遵守我们的网站规则。
免责声明
这些信息和出版物并非旨在提供,也不构成TradingView提供或认可的任何形式的财务、投资、交易或其他类型的建议或推荐。请阅读使用条款了解更多信息。
开源脚本
秉承TradingView的精神,该脚本的作者将其开源,以便交易者可以查看和验证其功能。向作者致敬!您可以免费使用该脚本,但请记住,重新发布代码须遵守我们的网站规则。
免责声明
这些信息和出版物并非旨在提供,也不构成TradingView提供或认可的任何形式的财务、投资、交易或其他类型的建议或推荐。请阅读使用条款了解更多信息。