PROTECTED SOURCE SCRIPT
已更新 ADX + DI + EMA Dashboard (BKNY)
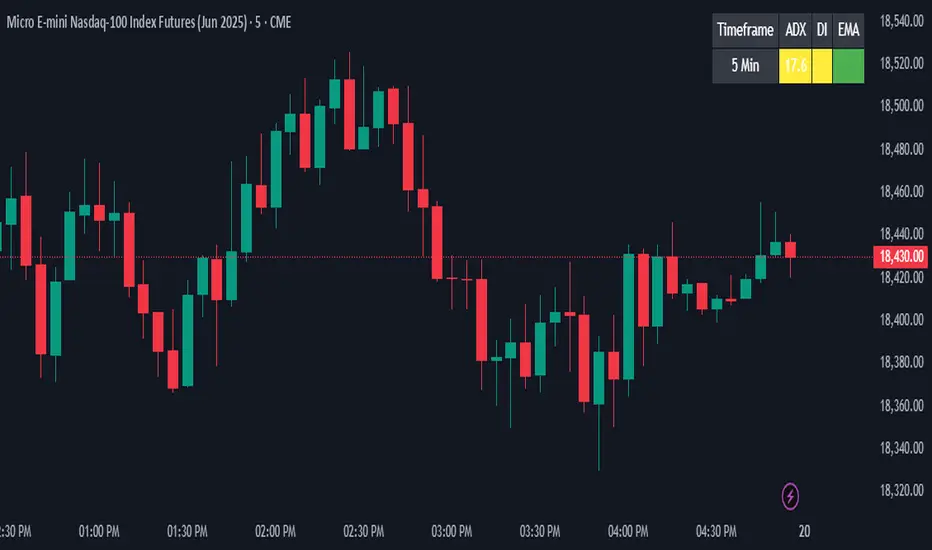
This Indicator creates a dynamic dashboard that combines ADX (Average Directional Index), Directional Movement Index (DI), and Exponential Moving Averages (EMA) to provide a comprehensive view of market trends. The indicator helps traders assess the strength and direction of trends based on key technical indicators.
Features:
ADX: Measures the strength of the trend, allowing traders to identify whether a trend is strong or weak.
+DI and -DI: Show the bullish and bearish directional movements, helping to identify market direction.
EMA Crossover: Compares the fast and slow EMAs to determine the trend’s direction.
Customizable Features:
Adjust the calculation length for ADX, DI, and EMAs.
Set ADX and DI thresholds to define trend strength and direction.
EMA lengths are fully customizable for both fast and slow EMAs.
Display options allow users to show or hide ADX, DI, and EMA values on the dashboard.
Customize the colors to represent bullish, bearish, or neutral trend conditions for ADX, DI, and EMA.
Timeframe selection allows users to choose the preferred timeframe for trend analysis.
The dashboard layout and display are fully customizable, letting users tailor the information shown according to their trading preferences.
This script provides an at-a-glance view of key trend indicators, with flexibility to tailor both the data shown and the visual presentation to individual trading needs.
版本注释
This Indicator creates a dynamic dashboard that combines ADX (Average Directional Index), Directional Movement Index (DI), and Exponential Moving Averages (EMA) to provide a comprehensive view of market trends. The indicator helps traders assess the strength and direction of trends based on key technical indicators.Features:
ADX: Measures the strength of the trend, allowing traders to identify whether a trend is strong or weak.
+DI and -DI: Show the bullish and bearish directional movements, helping to identify market direction.
EMA Crossover: Compares the fast and slow EMAs to determine the trend’s direction.
Customizable Features:
Adjust the calculation length for ADX, DI, and EMAs.
Set ADX and DI thresholds to define trend strength and direction.
EMA lengths are fully customizable for both fast and slow EMAs.
Display options allow users to show or hide ADX, DI, and EMA values on the dashboard.
Customize the colors to represent bullish, bearish, or neutral trend conditions for ADX, DI, and EMA.
Timeframe selection allows users to choose the preferred timeframe for trend analysis.
The dashboard layout and display are fully customizable, letting users tailor the information shown according to their trading preferences.
This script provides an at-a-glance view of key trend indicators, with flexibility to tailor both the data shown and the visual presentation to individual trading needs.
1 hour ago
Release Notes
This Indicator creates a dynamic dashboard that combines ADX (Average Directional Index), Directional Movement Index (DI), and Exponential Moving Averages (EMA) to provide a comprehensive view of market trends. The indicator helps traders assess the strength and direction of trends based on key technical indicators.
Features:
ADX: Measures the strength of the trend, allowing traders to identify whether a trend is strong or weak.
+DI and -DI: Show the bullish and bearish directional movements, helping to identify market direction.
EMA Crossover: Compares the fast and slow EMAs to determine the trend’s direction.
Customizable Features:
Adjust the calculation length for ADX, DI, and EMAs.
Set ADX and DI thresholds to define trend strength and direction.
EMA lengths are fully customizable for both fast and slow EMAs.
Display options allow users to show or hide ADX, DI, and EMA values on the dashboard.
Customize the colors to represent bullish, bearish, or neutral trend conditions for ADX, DI, and EMA.
Timeframe selection allows users to choose the preferred timeframe for trend analysis.
The dashboard layout and display are fully customizable, letting users tailor the information shown according to their trading preferences.
This script provides an at-a-glance view of key trend indicators, with flexibility to tailor both the data shown and the visual presentation to individual trading needs.
版本注释
Increased precision of calculated values受保护脚本
此脚本以闭源形式发布。 但是,您可以自由使用,没有任何限制 — 了解更多信息这里。
免责声明
这些信息和出版物并非旨在提供,也不构成TradingView提供或认可的任何形式的财务、投资、交易或其他类型的建议或推荐。请阅读使用条款了解更多信息。
免责声明
这些信息和出版物并非旨在提供,也不构成TradingView提供或认可的任何形式的财务、投资、交易或其他类型的建议或推荐。请阅读使用条款了解更多信息。