INVITE-ONLY SCRIPT
Sniper Trade Fx Heat Map
📊 Sniper Trade Fx Heat Map (v6)
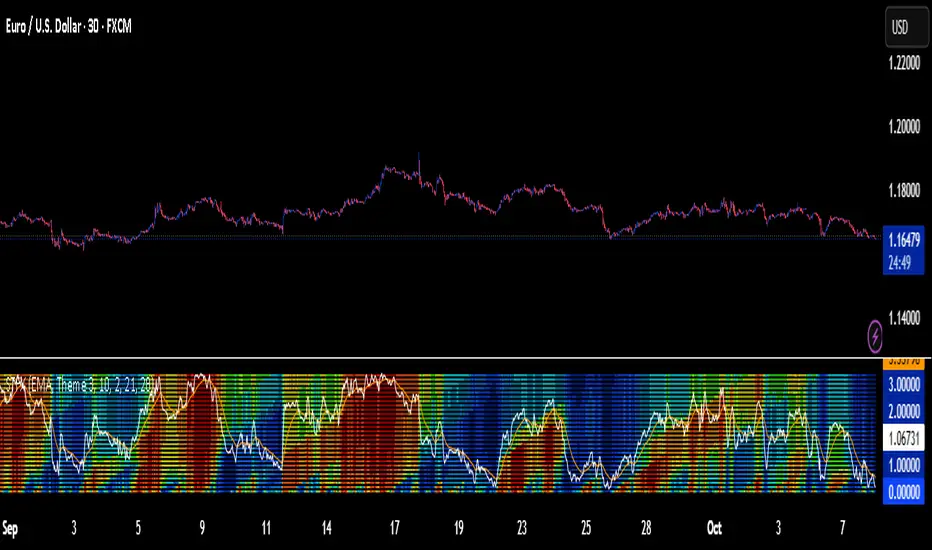
The Sniper Trade Fx Heat Map is a custom oscillator built from a stack of 28 stochastic oscillators, arranged horizontally and vertically, creating a layered “heat map” view of market momentum.
Lower rows = short-term stochastics (faster, sensitive to quick moves).
Upper rows = long-term stochastics (slower, capture major swings).
Each stochastic value is interpreted and color-coded depending on strength.
The average of all 28 stochastics is calculated → this creates the Fast line.
The Fast line is then smoothed to create a Slow line for confirmation.
Optionally, the candle bars are colored to reflect the oscillator state.
This setup gives a multi-timeframe momentum map, showing when the market is overbought, oversold, or neutral at a glance.
🎨 Color Logic by Theme
🔹 Theme 1 (Classic)
High stochastic values (50–100) = Shades of Green → Overbought / bullish momentum.
Low stochastic values (0–50) = Shades of Red → Oversold / bearish momentum.
👉 This is the most traditional color scheme: Green = Up, Red = Down.
🔹 Theme 2 (Aqua / Purple)
High stochastic values (50–100) = Shades of Aqua / Teal → Overbought / bullish momentum.
Low stochastic values (0–50) = Shades of Purple / Violet → Oversold / bearish momentum.
👉 Useful if you prefer cooler tones to distinguish trend phases.
🔹 Theme 3 (Heat Spectrum)
High stochastic values (50–100) = Red → Yellow → Green gradient → Overbought / bullish momentum.
Deep Red = extremely overbought.
Yellow = mid-high.
Green = topping but stabilizing.
Low stochastic values (0–50) = Blue → Cyan gradient → Oversold / bearish momentum.
Dark Blue = extremely oversold.
Lighter Cyan = recovering.
👉 This theme gives a heat map feel, with red showing extreme highs and blue showing extreme lows.
📈 Trading Directions
Look at the Heat Map Layers
If most rows are the same color (all green, all aqua, or all red/yellow depending on theme), momentum is strongly aligned.
If colors are mixed (checkerboard), market is choppy → avoid trades.
Use Fast/Slow Oscillator Crossovers
Bullish Signal (Buy): Fast crosses above Slow while the heat map is showing oversold colors (Red in Theme 1, Purple in Theme 2, Blue in Theme 3).
Bearish Signal (Sell): Fast crosses below Slow while the heat map is showing overbought colors (Green in Theme 1, Aqua in Theme 2, Red/Yellow in Theme 3).
Bar Coloring for Entries
When enabled, candles will automatically reflect the dominant heat map color.
Enter trades when candle colors confirm the Fast/Slow crossover direction.
✅ Summary Rule of Thumb:
Theme 1: Green = overbought, Red = oversold.
Theme 2: Aqua = overbought, Purple = oversold.
Theme 3: Red/Yellow/Green = overbought, Blue/Cyan = oversold.
仅限邀请脚本
只有经作者批准的用户才能访问此脚本。您需要申请并获得使用权限。该权限通常在付款后授予。如需了解更多详情,请按照以下作者的说明操作,或直接联系snipertradefxconnect。
除非您完全信任其作者并了解脚本的工作原理,否則TradingView不建议您付费或使用脚本。您还可以在我们的社区脚本中找到免费的开源替代方案。
作者的说明
Your STFX Heat Map
The SYNERGY Engine is Invite-Only. Lock in your access now!
Secure Your TradingView Username
Find/Create your exact TradingView username. You'll need it post-purchase.
免责声明
这些信息和出版物并不意味着也不构成TradingView提供或认可的金融、投资、交易或其它类型的建议或背书。请在使用条款阅读更多信息。