OPEN-SOURCE SCRIPT
已更新 RSI vs BITFINEX BTC Longs/Shorts Margin Ratio Percentage Rank
This indicator plots the RSI of the current token with a color based on percentage rank of the RSI of BITFINEX:BTCUSDLONGS divided by BITFINEX:BTCUSDSHORTS, with a plot of the moving average of the RSI. It can optionally plot the RSI in white and the ratio RSI in color, or the ratio as background color. It can also plot the raw ratio rather than the percentage rank if selected.
I was interested in the ratio of BITFINEX:BTCUSDLONGS to BITFINEX:BTCUSDSHORTS as a measure of market sentiment and how that sentiment would magnify RSI changes. The volatility of the BTCUSDLONGS : BTCUSDSHORTS ratio was too low to get a good read, using a percent rank of the RSI of the ratio made the results more visible.
This indicator should be used on a BTC chart.
版本注释
The colors can make it had to see the MA in the background or "ratio and RSI" modes, so added an option to have different color transparency options above / below the MA.Updated the chart to show all three color options available in the indicator.
版本注释
1.02 • When I released "RSI vs Longs/Shorts Margin Ratio Percentage Rank" I thought I'd let this BTC only indicator die off, but I then thought about allowing all of the BITFINEX:BTCxxxLONGS and BITFINEX:BTCxxxSHORTS pairs to be included in the one ratio. So this indicator now has the option to add the LONGS and SHORTS pairs for USD, UST, EUR, EUT, JPY and GBP. The second indicator on the chart shows the USD and UST ratios, while the third indicator shows the EUR, EUT, JPY and GBP ratios. This appears to be showing regional variations to BTC market sentiment.
• Added RBlG spectrum, I like Red Black Green spectrum as a background color, as seen in the bottom indicator on the chart.
• Moved to a drop down list for plot style.
• Added an option to plot the top and bottom lines.
版本注释
1.03• Aligned with 'RSI vs Longs/Shorts Margin Ratio Percentage Rank' v1.01
• Got rid of the average, not needed
• Added alerts
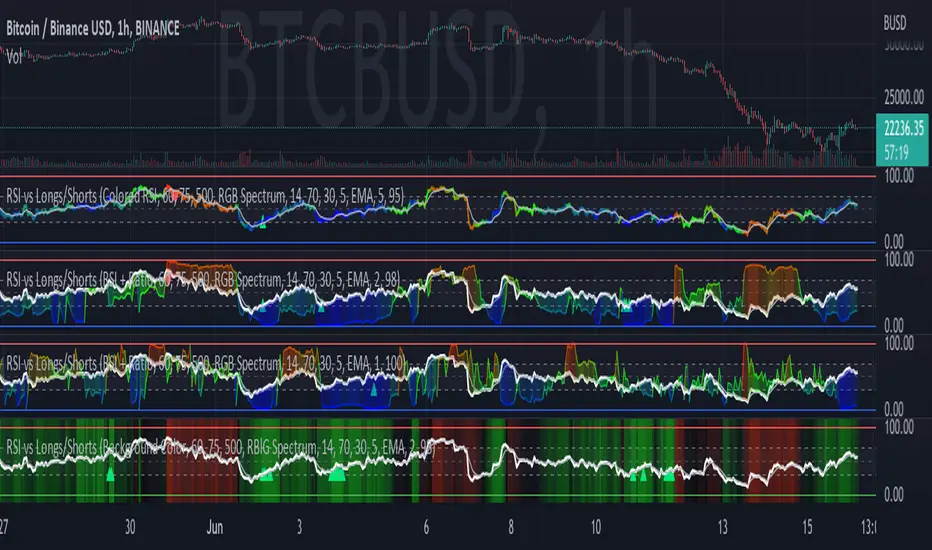
Alerts can be triggered and or shown on the chart when the Ratio is Above / Below specified values, with the option to filter by the RSI being beyond the displayed upper and lower limits and or the RSI above / below its moving average.
The four indicators displayed in this update show the 1hr BTCBUSD with alerts based on:
Indicator 1: RSI Beyond Bands, RSI MA Filter, Ratio Below 5 and Ratio Above 95
Indicator 2: RSI Beyond Bands, Ratio Below 2 and Ratio Above 98
Indicator 3: Ratio Below 1 and Ratio Above 100
Indicator 4: RSI MA Filter, Ratio Below 2 and Ratio Above 98
• Moved request.security to a function
开源脚本
秉承TradingView的精神,该脚本的作者将其开源,以便交易者可以查看和验证其功能。向作者致敬!您可以免费使用该脚本,但请记住,重新发布代码须遵守我们的网站规则。
免责声明
这些信息和出版物并非旨在提供,也不构成TradingView提供或认可的任何形式的财务、投资、交易或其他类型的建议或推荐。请阅读使用条款了解更多信息。
免责声明
这些信息和出版物并非旨在提供,也不构成TradingView提供或认可的任何形式的财务、投资、交易或其他类型的建议或推荐。请阅读使用条款了解更多信息。