OPEN-SOURCE SCRIPT
Mobo Bands
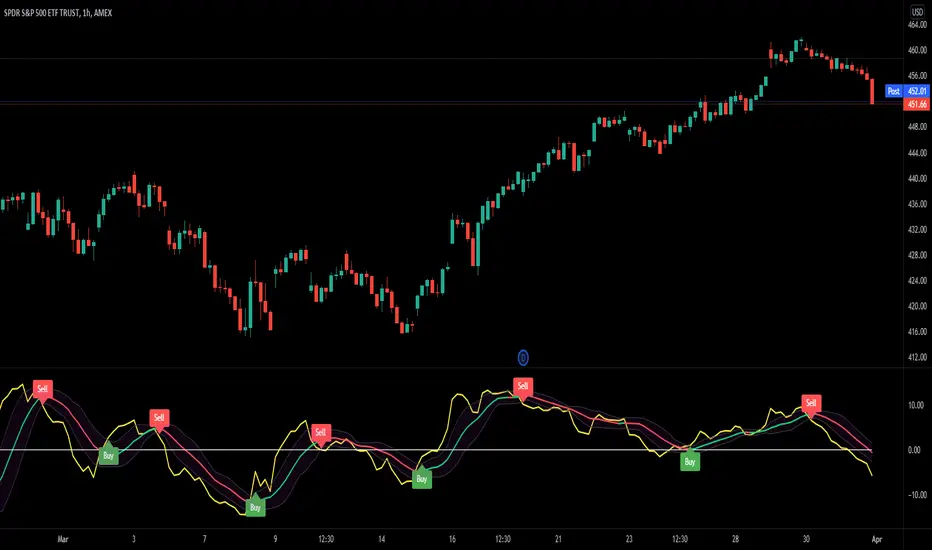
This indicator is the Mobo Bands (Momentum Breakout Bands). These bands are bollinger bands that have an adjusted standard deviation. There are Buy signals when it has momentum breakouts above the bands for moves to the upside and Sell signals when it has momentum breakouts below the bands for moves to the downside. The bands simply suggest that all markets have periods of chop which we all know to be true. While the price is inside the bands it is said to be trendless. Once the breakouts happen you can take trades in the breakout direction. I like to use these to swing trade options on the hourly timeframe but the bands should work on most instruments and timeframes. I like to use it to take swings on SPY on the 1 hour chart for entries and use the Daily chart for trend confirmation.
开源脚本
秉承TradingView的精神,该脚本的作者将其开源,以便交易者可以查看和验证其功能。向作者致敬!您可以免费使用该脚本,但请记住,重新发布代码须遵守我们的网站规则。
免责声明
这些信息和出版物并非旨在提供,也不构成TradingView提供或认可的任何形式的财务、投资、交易或其他类型的建议或推荐。请阅读使用条款了解更多信息。
开源脚本
秉承TradingView的精神,该脚本的作者将其开源,以便交易者可以查看和验证其功能。向作者致敬!您可以免费使用该脚本,但请记住,重新发布代码须遵守我们的网站规则。
免责声明
这些信息和出版物并非旨在提供,也不构成TradingView提供或认可的任何形式的财务、投资、交易或其他类型的建议或推荐。请阅读使用条款了解更多信息。