OPEN-SOURCE SCRIPT
Taylor True Ranges - deviations
Description:
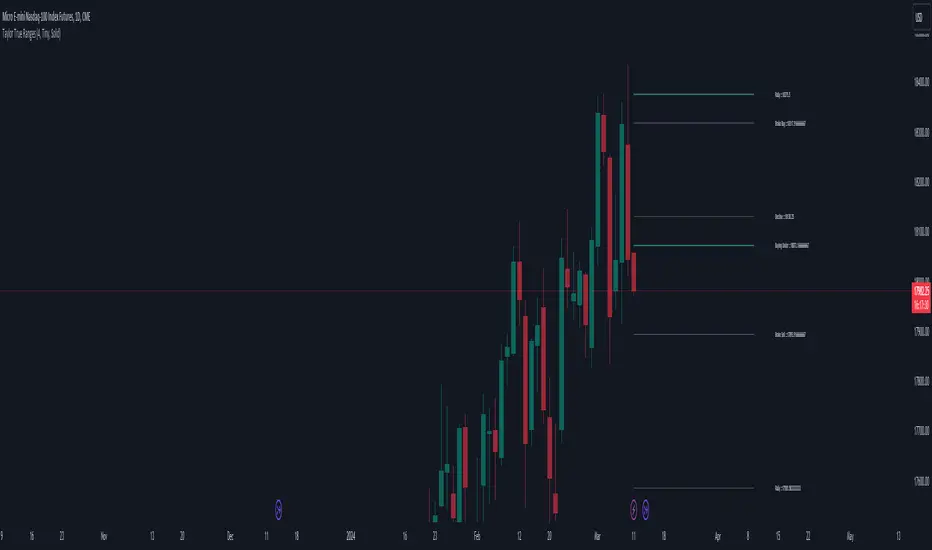
The Taylor True Ranges - Deviations indicator in Pine Script 5.0 computes various price levels and averages based on Taylor's trading principles. It provides insights into potential buying and selling opportunities by analyzing deviations from average price movements. The indicator calculates and visualizes critical levels such as Decline Average, Buying Under Average, Pivot Brake Sell, Rally Average, Buying High Average, and Pivot Brake Buy. These levels are derived from historical price data and help traders identify key support and resistance zones, trend reversals, and breakout points.
Key Features:
Taylor's Trading Principles: The indicator implements Taylor's methodology to analyze price movements and identify trading opportunities based on deviations from average ranges.
Multiple Price Levels: It calculates and displays various price levels, including Decline Average, Buying Under Average, Pivot Brake Sell, Rally Average, Buying High Average, and Pivot Brake Buy.
Customizable Visualization: Traders can customize the visualization by toggling the display of individual price levels and adjusting the appearance settings such as line style, color, and text size.
Daily Lookback: The indicator supports a customizable daily lookback period, allowing traders to analyze historical price movements over a specified timeframe.
Usage:
Apply the Taylor True Ranges - Deviations indicator to your chart to analyze deviations from average price movements and identify potential trading opportunities.
Customize the indicator settings, including the daily lookback period, line style, color, and text size, to suit your trading preferences and analysis requirements.
Use the calculated price levels and averages as part of your technical analysis to make informed trading decisions, including identifying support and resistance levels, trend reversals, and breakout points.
Example:
Traders can use the Taylor True Ranges - Deviations indicator to analyze deviations from average price movements and identify key support and resistance levels. For instance, observing a Pivot Brake Sell level crossing above the current price might indicate a potential selling opportunity, while a Pivot Brake Buy level crossing below the price could signal a buying opportunity.
开源脚本
秉承TradingView的精神,该脚本的作者将其开源,以便交易者可以查看和验证其功能。向作者致敬!您可以免费使用该脚本,但请记住,重新发布代码须遵守我们的网站规则。
免责声明
这些信息和出版物并非旨在提供,也不构成TradingView提供或认可的任何形式的财务、投资、交易或其他类型的建议或推荐。请阅读使用条款了解更多信息。
免责声明
这些信息和出版物并非旨在提供,也不构成TradingView提供或认可的任何形式的财务、投资、交易或其他类型的建议或推荐。请阅读使用条款了解更多信息。