OPEN-SOURCE SCRIPT
ChArt Path
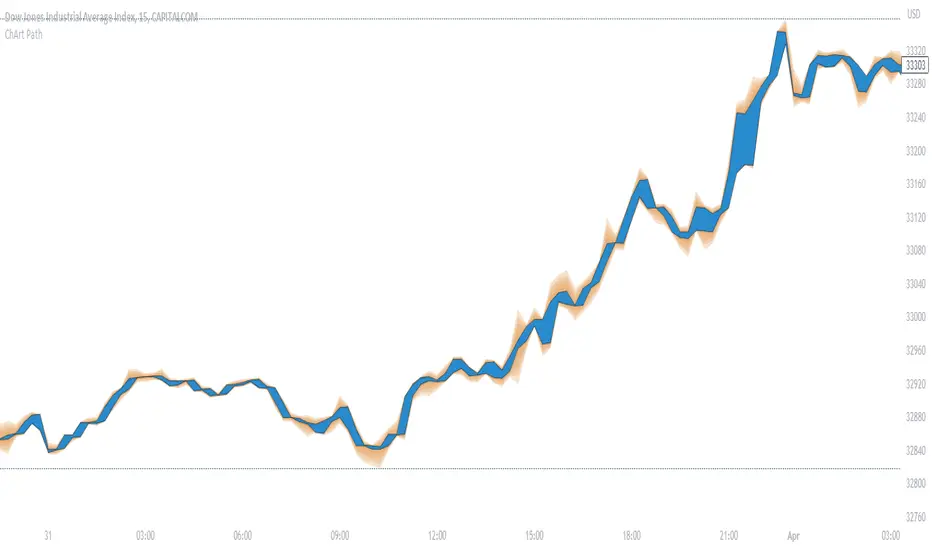
"ChArt Path" shows the same datas as the candles, but as a channel, instead of individual candles.
It allows to focus on the direction of the price (instead of wondering the meaning of each candle), which hopefully simplifies the analysis, and reduces the confusion.
Also, it is artistically customizable!
A little time might be necessary to get used to this indicator.
NOTES FOR INSTALLATION:
- Japanese candles might be more expressive than Heiken Ashi, with this indicator.
- Hide the candles in the chart settings (right click on an empty space in the chart, then "Settings", "Symbol", and uncheck "Body", "Borders" and "Wick").
- Add "ChArt Path" to the chart.
- In the indicator's settings, choose the options you prefer. The Advanced setting are tuned by default for dark themes (bgcolor: black/#0a0c12). Feel free to make them your own!
HOW TO READ THE CHART?
- The path is between 2 borders (black by default) that represent the body of the candle (without the wicks).
- The wicks are represented around the path, as a gradient. This makes a price rejection very easy to spot, as a spike for ex.

SETTINGS
The standard settings are simple. You can pick 2 colors (bullish and bearish) for the path. And 1 color for the wicks.
The advanced settings let you customize the wicks' colors and opacity. You can also activate the gradient of volumes inside the path, to indicate the volume behind each candle.
HOW TO USE CHART PATH?
I use it on 2 timeframes (direction/entry), both with FREMA Trend (See below).
When there is a wick spike (price rejection), followed by an arrow signal in FREMA Trend, then there might be an opportunity. I look for confirmations from different origins, like volume, momentum, and cycles.

DO NOT BASE YOUR TRADING DECISIONS ON 1 SINGLE INDICATOR'S SIGNALS.
Always confirm your ideas by other means, like price action and indicators of a different nature.
NOTES ABOUT THE GRADIENT OF VOLUMES:
The more intense is the color, the bigger is the volume.
The unit is a 400 periods moving average of the volumes, considered as 1 volume.
Each color represents half of this volume. For ex: Grays indicate under (or equal) to the 400 MA (low volumes). Bright yellow represents above 7 times the 400 MA (very high volumes).
When there's no available volume datas, the candles turn bright green by default.
It allows to focus on the direction of the price (instead of wondering the meaning of each candle), which hopefully simplifies the analysis, and reduces the confusion.
Also, it is artistically customizable!
A little time might be necessary to get used to this indicator.
NOTES FOR INSTALLATION:
- Japanese candles might be more expressive than Heiken Ashi, with this indicator.
- Hide the candles in the chart settings (right click on an empty space in the chart, then "Settings", "Symbol", and uncheck "Body", "Borders" and "Wick").
- Add "ChArt Path" to the chart.
- In the indicator's settings, choose the options you prefer. The Advanced setting are tuned by default for dark themes (bgcolor: black/#0a0c12). Feel free to make them your own!
HOW TO READ THE CHART?
- The path is between 2 borders (black by default) that represent the body of the candle (without the wicks).
- The wicks are represented around the path, as a gradient. This makes a price rejection very easy to spot, as a spike for ex.
SETTINGS
The standard settings are simple. You can pick 2 colors (bullish and bearish) for the path. And 1 color for the wicks.
The advanced settings let you customize the wicks' colors and opacity. You can also activate the gradient of volumes inside the path, to indicate the volume behind each candle.
HOW TO USE CHART PATH?
I use it on 2 timeframes (direction/entry), both with FREMA Trend (See below).
When there is a wick spike (price rejection), followed by an arrow signal in FREMA Trend, then there might be an opportunity. I look for confirmations from different origins, like volume, momentum, and cycles.
DO NOT BASE YOUR TRADING DECISIONS ON 1 SINGLE INDICATOR'S SIGNALS.
Always confirm your ideas by other means, like price action and indicators of a different nature.
NOTES ABOUT THE GRADIENT OF VOLUMES:
The more intense is the color, the bigger is the volume.
The unit is a 400 periods moving average of the volumes, considered as 1 volume.
Each color represents half of this volume. For ex: Grays indicate under (or equal) to the 400 MA (low volumes). Bright yellow represents above 7 times the 400 MA (very high volumes).
When there's no available volume datas, the candles turn bright green by default.
开源脚本
秉承TradingView的精神,该脚本的作者将其开源,以便交易者可以查看和验证其功能。向作者致敬!您可以免费使用该脚本,但请记住,重新发布代码须遵守我们的网站规则。
免责声明
这些信息和出版物并非旨在提供,也不构成TradingView提供或认可的任何形式的财务、投资、交易或其他类型的建议或推荐。请阅读使用条款了解更多信息。
开源脚本
秉承TradingView的精神,该脚本的作者将其开源,以便交易者可以查看和验证其功能。向作者致敬!您可以免费使用该脚本,但请记住,重新发布代码须遵守我们的网站规则。
免责声明
这些信息和出版物并非旨在提供,也不构成TradingView提供或认可的任何形式的财务、投资、交易或其他类型的建议或推荐。请阅读使用条款了解更多信息。