OPEN-SOURCE SCRIPT
Balgat Ekibi
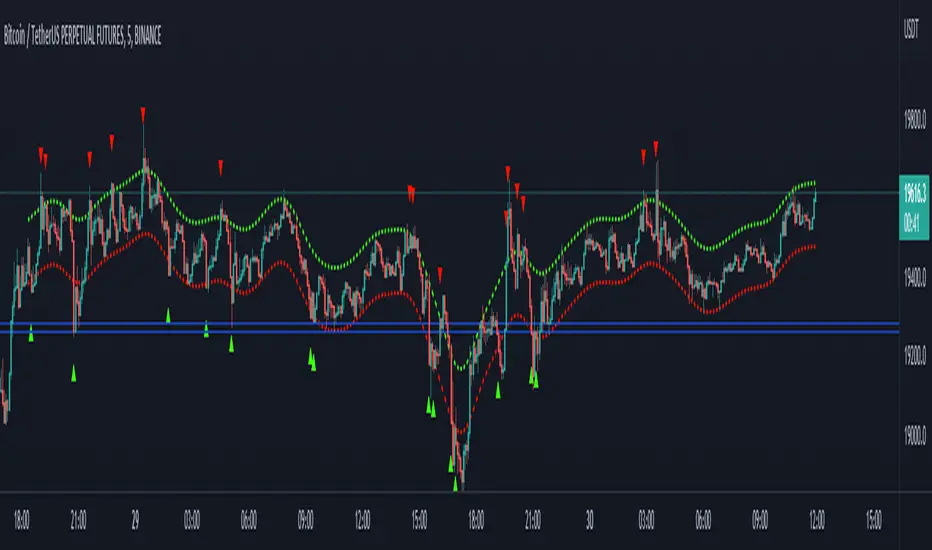
Bands are calculated with the std error and variance of the price actions. So if price cross up or cross down the variance bands, you could expect a reversal movement.
So if price cross up with the bands and after that there is a reversal candle movement, a short position could be taken.
If price cross down to the bands and after that there is a reversal candle movement, a long positon could be taken.
All risk management and money management is up to you.
So if price cross up with the bands and after that there is a reversal candle movement, a short position could be taken.
If price cross down to the bands and after that there is a reversal candle movement, a long positon could be taken.
All risk management and money management is up to you.
开源脚本
秉承TradingView的精神,该脚本的作者将其开源,以便交易者可以查看和验证其功能。向作者致敬!您可以免费使用该脚本,但请记住,重新发布代码须遵守我们的网站规则。
免责声明
这些信息和出版物并非旨在提供,也不构成TradingView提供或认可的任何形式的财务、投资、交易或其他类型的建议或推荐。请阅读使用条款了解更多信息。
免责声明
这些信息和出版物并非旨在提供,也不构成TradingView提供或认可的任何形式的财务、投资、交易或其他类型的建议或推荐。请阅读使用条款了解更多信息。