OPEN-SOURCE SCRIPT
Squeeze Momentum Indicator
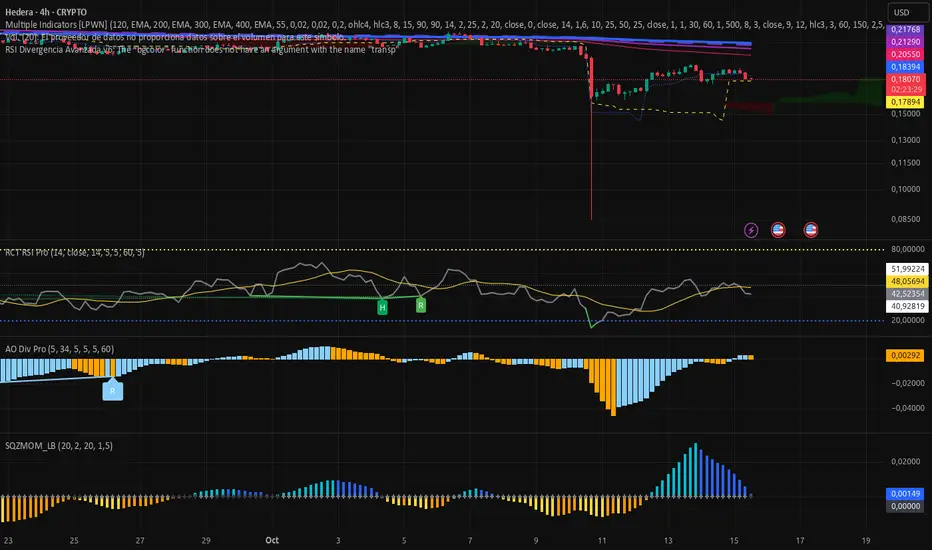
This indicator identifies periods of low market volatility—commonly referred to as a "squeeze"—by comparing Bollinger Bands and Keltner Channels. When volatility compresses, price often prepares for a directional breakout. The histogram visualizes momentum strength and direction once the squeeze ends.
**How it works:**
- **Squeeze detection**: A squeeze is active when Bollinger Bands are fully contained within Keltner Channels. This appears as black crosses on the zero line.
- **Volatility expansion**: When Bollinger Bands move outside Keltner Channels, volatility is increasing. This state is marked with blue crosses.
- **Momentum histogram**: The core signal is a linear regression of price relative to a dynamic baseline (average of the highest high, lowest low, and SMA over the lookback period).
- **Aqua**: Positive momentum that is accelerating.
- **Bright blue**: Positive momentum that is decelerating.
- **Yellow**: Negative momentum that is accelerating downward.
- **Orange**: Negative momentum that is decelerating (potential reversal zone).
**Usage notes:**
Traders often monitor the transition from squeeze (black) to expansion (blue) combined with a strong histogram move away from zero as a potential entry signal. Color changes in the histogram help assess momentum shifts before price makes large moves.
This script is designed for educational and analytical purposes. It does not constitute investment advice. Always test strategies in a simulated environment before applying them to live trading.
开源脚本
本着TradingView的真正精神,此脚本的创建者将其开源,以便交易者可以查看和验证其功能。向作者致敬!虽然您可以免费使用它,但请记住,重新发布代码必须遵守我们的网站规则。
免责声明
这些信息和出版物并不意味着也不构成TradingView提供或认可的金融、投资、交易或其它类型的建议或背书。请在使用条款阅读更多信息。
开源脚本
本着TradingView的真正精神,此脚本的创建者将其开源,以便交易者可以查看和验证其功能。向作者致敬!虽然您可以免费使用它,但请记住,重新发布代码必须遵守我们的网站规则。
免责声明
这些信息和出版物并不意味着也不构成TradingView提供或认可的金融、投资、交易或其它类型的建议或背书。请在使用条款阅读更多信息。