OPEN-SOURCE SCRIPT
Slingshot Trend 🎯⏰
How to Use the Slingshot Trend Indicator 🎯⏰ (65-Minute Timeframe)
The **Slingshot Trend Indicator** helps spot bullish trend entries using price action and EMAs, optimized for your favorite 65-minute timeframe. Here’s a simple guide:
⚙️ Setup
- Add the indicator to your chart.
- Set the 89 EMA timeframe to 65 minutes (or keep the default 195 minutes for higher-timeframe confirmation).
🔑 Key Features
- **Slingshot EMA**: Short-term EMA (default length: 4) to detect breakouts.
- **EMA Stack**: Confirms bullish trend when 21 EMA > 34 EMA > 55 EMA > 89 EMA.
- **Price Above 89 EMA**: Ensures price is above the 65-minute 89 EMA.
- **ATR Targets**: Uses 14-period ATR for dynamic price targets.
- **Visuals**:
- Blue EMA line (optional).
- Teal bars for bullish conditions (optional).
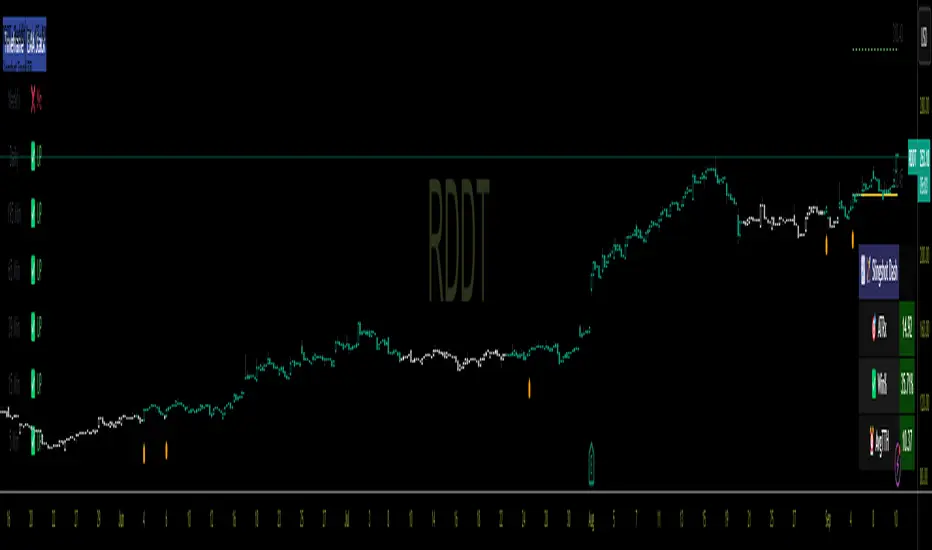
- Orange labels for entry signals (optional).
- Yellow entry line and green dashed target line (optional).
- Price labels for entry/target (optional).
- ATR dashboard showing average ATR multiple, win %, and time-to-target (optional).
📘 How to Trade
- **Entry**: Go long when an orange label appears (price closes above Slingshot EMA after three closes below, with bullish EMAs on the 65-minute chart).
- **Target**: Aim for the green dashed line (entry price + ATR-based target).
- **Exit**: Close when bullish conditions end (EMAs not stacked or price below 65-minute 89 EMA).
- **Stop Loss**: Not included; consider 2× ATR below entry or a support level.
- **Alerts**: Enable “First Trending SlingShot” for entry notifications.
✨ Customize
Adjust in settings:
- 89 EMA timeframe (e.g., set to 65 minutes).
- Bar color (default: teal).
- Toggle EMA line, bar coloring, entry labels, lines, price labels, and dashboard.
- Slingshot EMA length (default: 4).
💡 Tips
- Backtest on the 65-minute timeframe for your asset.
- Combine with support/resistance or other indicators.
- Use proper risk management.
The **Slingshot Trend Indicator** helps spot bullish trend entries using price action and EMAs, optimized for your favorite 65-minute timeframe. Here’s a simple guide:
⚙️ Setup
- Add the indicator to your chart.
- Set the 89 EMA timeframe to 65 minutes (or keep the default 195 minutes for higher-timeframe confirmation).
🔑 Key Features
- **Slingshot EMA**: Short-term EMA (default length: 4) to detect breakouts.
- **EMA Stack**: Confirms bullish trend when 21 EMA > 34 EMA > 55 EMA > 89 EMA.
- **Price Above 89 EMA**: Ensures price is above the 65-minute 89 EMA.
- **ATR Targets**: Uses 14-period ATR for dynamic price targets.
- **Visuals**:
- Blue EMA line (optional).
- Teal bars for bullish conditions (optional).
- Orange labels for entry signals (optional).
- Yellow entry line and green dashed target line (optional).
- Price labels for entry/target (optional).
- ATR dashboard showing average ATR multiple, win %, and time-to-target (optional).
📘 How to Trade
- **Entry**: Go long when an orange label appears (price closes above Slingshot EMA after three closes below, with bullish EMAs on the 65-minute chart).
- **Target**: Aim for the green dashed line (entry price + ATR-based target).
- **Exit**: Close when bullish conditions end (EMAs not stacked or price below 65-minute 89 EMA).
- **Stop Loss**: Not included; consider 2× ATR below entry or a support level.
- **Alerts**: Enable “First Trending SlingShot” for entry notifications.
✨ Customize
Adjust in settings:
- 89 EMA timeframe (e.g., set to 65 minutes).
- Bar color (default: teal).
- Toggle EMA line, bar coloring, entry labels, lines, price labels, and dashboard.
- Slingshot EMA length (default: 4).
💡 Tips
- Backtest on the 65-minute timeframe for your asset.
- Combine with support/resistance or other indicators.
- Use proper risk management.
开源脚本
本着TradingView的真正精神,此脚本的创建者将其开源,以便交易者可以查看和验证其功能。向作者致敬!虽然您可以免费使用它,但请记住,重新发布代码必须遵守我们的网站规则。
免责声明
这些信息和出版物并不意味着也不构成TradingView提供或认可的金融、投资、交易或其它类型的建议或背书。请在使用条款阅读更多信息。
开源脚本
本着TradingView的真正精神,此脚本的创建者将其开源,以便交易者可以查看和验证其功能。向作者致敬!虽然您可以免费使用它,但请记住,重新发布代码必须遵守我们的网站规则。
免责声明
这些信息和出版物并不意味着也不构成TradingView提供或认可的金融、投资、交易或其它类型的建议或背书。请在使用条款阅读更多信息。