OPEN-SOURCE SCRIPT
My Price Curtain by @magasine - v20251217
**My Price Curtain by magasine - v20251217**
This is a highly visual and practical TradingView overlay indicator designed to help traders quickly assess price position relative to a reference average (either a dynamic Simple Moving Average or a user-defined fixed price, such as a personal average entry cost).
### Key Features & Value for Traders:
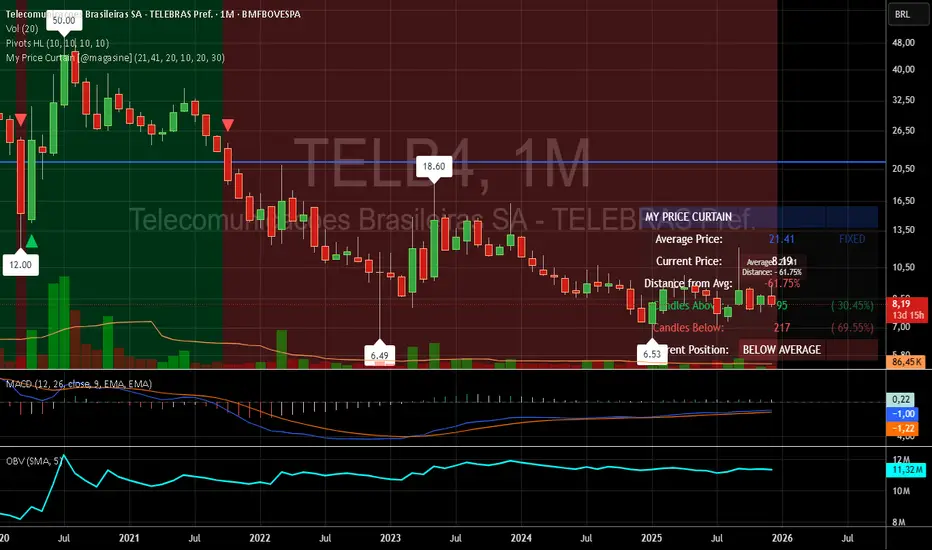
- **Dynamic Price Curtain Background**
The entire chart background is lightly tinted green when price is above the average, red when below, or gray when at parity. This instant color feedback provides an immediate sense of bullish/bearish bias without needing to interpret lines or oscillators.
- **Deviation Zones (Optional)**
When enabled, semi-transparent horizontal bands appear above (green) and below (red) the average price, sized according to a user-defined percentage deviation (default 5%). These zones act as visual "fair value" corridors, highlighting over-extension or potential mean-reversion areas.
- **Persistent Horizontal Reference Lines**
- Solid blue line: the current average price (SMA or fixed)
- Dotted lines: upper and lower deviation zone boundaries
- Thin trailing line (when using SMA): connects previous SMA values for smoother trend visualization
- **Real-Time Information Panel**
A clean table in the bottom-right corner displays:
- Current average price and type (SMA(length) or FIXED)
- Latest close price
- Percentage distance from the average
- Total candles above/below the average (with percentages)
- Current position status (ABOVE/BELOW/AT AVERAGE) with color-coded highlighting
- **Additional Visual Cues**
- Small triangle markers on crossovers/crossunders of the average price
- Floating label on the last bar showing the average and current % deviation
- **Optional Cross Alerts**
Configurable alerts fire when price crosses above or below the reference average, including price, average, and deviation details.
### Why Traders Love It:
- Perfect for position traders monitoring performance relative to their average cost
- Great for mean-reversion or range-bound strategies using the deviation zones
- Excellent contextual awareness tool on any timeframe or asset
- Clean, non-cluttered design that enhances rather than overwhelms price action
In short, My Price Curtain transforms a simple moving average into a powerful, intuitive "price sentiment dashboard" that delivers instant visual context and actionable information at a glance.
Donations: linktr.ee/magasine
This is a highly visual and practical TradingView overlay indicator designed to help traders quickly assess price position relative to a reference average (either a dynamic Simple Moving Average or a user-defined fixed price, such as a personal average entry cost).
### Key Features & Value for Traders:
- **Dynamic Price Curtain Background**
The entire chart background is lightly tinted green when price is above the average, red when below, or gray when at parity. This instant color feedback provides an immediate sense of bullish/bearish bias without needing to interpret lines or oscillators.
- **Deviation Zones (Optional)**
When enabled, semi-transparent horizontal bands appear above (green) and below (red) the average price, sized according to a user-defined percentage deviation (default 5%). These zones act as visual "fair value" corridors, highlighting over-extension or potential mean-reversion areas.
- **Persistent Horizontal Reference Lines**
- Solid blue line: the current average price (SMA or fixed)
- Dotted lines: upper and lower deviation zone boundaries
- Thin trailing line (when using SMA): connects previous SMA values for smoother trend visualization
- **Real-Time Information Panel**
A clean table in the bottom-right corner displays:
- Current average price and type (SMA(length) or FIXED)
- Latest close price
- Percentage distance from the average
- Total candles above/below the average (with percentages)
- Current position status (ABOVE/BELOW/AT AVERAGE) with color-coded highlighting
- **Additional Visual Cues**
- Small triangle markers on crossovers/crossunders of the average price
- Floating label on the last bar showing the average and current % deviation
- **Optional Cross Alerts**
Configurable alerts fire when price crosses above or below the reference average, including price, average, and deviation details.
### Why Traders Love It:
- Perfect for position traders monitoring performance relative to their average cost
- Great for mean-reversion or range-bound strategies using the deviation zones
- Excellent contextual awareness tool on any timeframe or asset
- Clean, non-cluttered design that enhances rather than overwhelms price action
In short, My Price Curtain transforms a simple moving average into a powerful, intuitive "price sentiment dashboard" that delivers instant visual context and actionable information at a glance.
Donations: linktr.ee/magasine
开源脚本
秉承TradingView的精神,该脚本的作者将其开源,以便交易者可以查看和验证其功能。向作者致敬!您可以免费使用该脚本,但请记住,重新发布代码须遵守我们的网站规则。
免责声明
这些信息和出版物并非旨在提供,也不构成TradingView提供或认可的任何形式的财务、投资、交易或其他类型的建议或推荐。请阅读使用条款了解更多信息。
免责声明
这些信息和出版物并非旨在提供,也不构成TradingView提供或认可的任何形式的财务、投资、交易或其他类型的建议或推荐。请阅读使用条款了解更多信息。